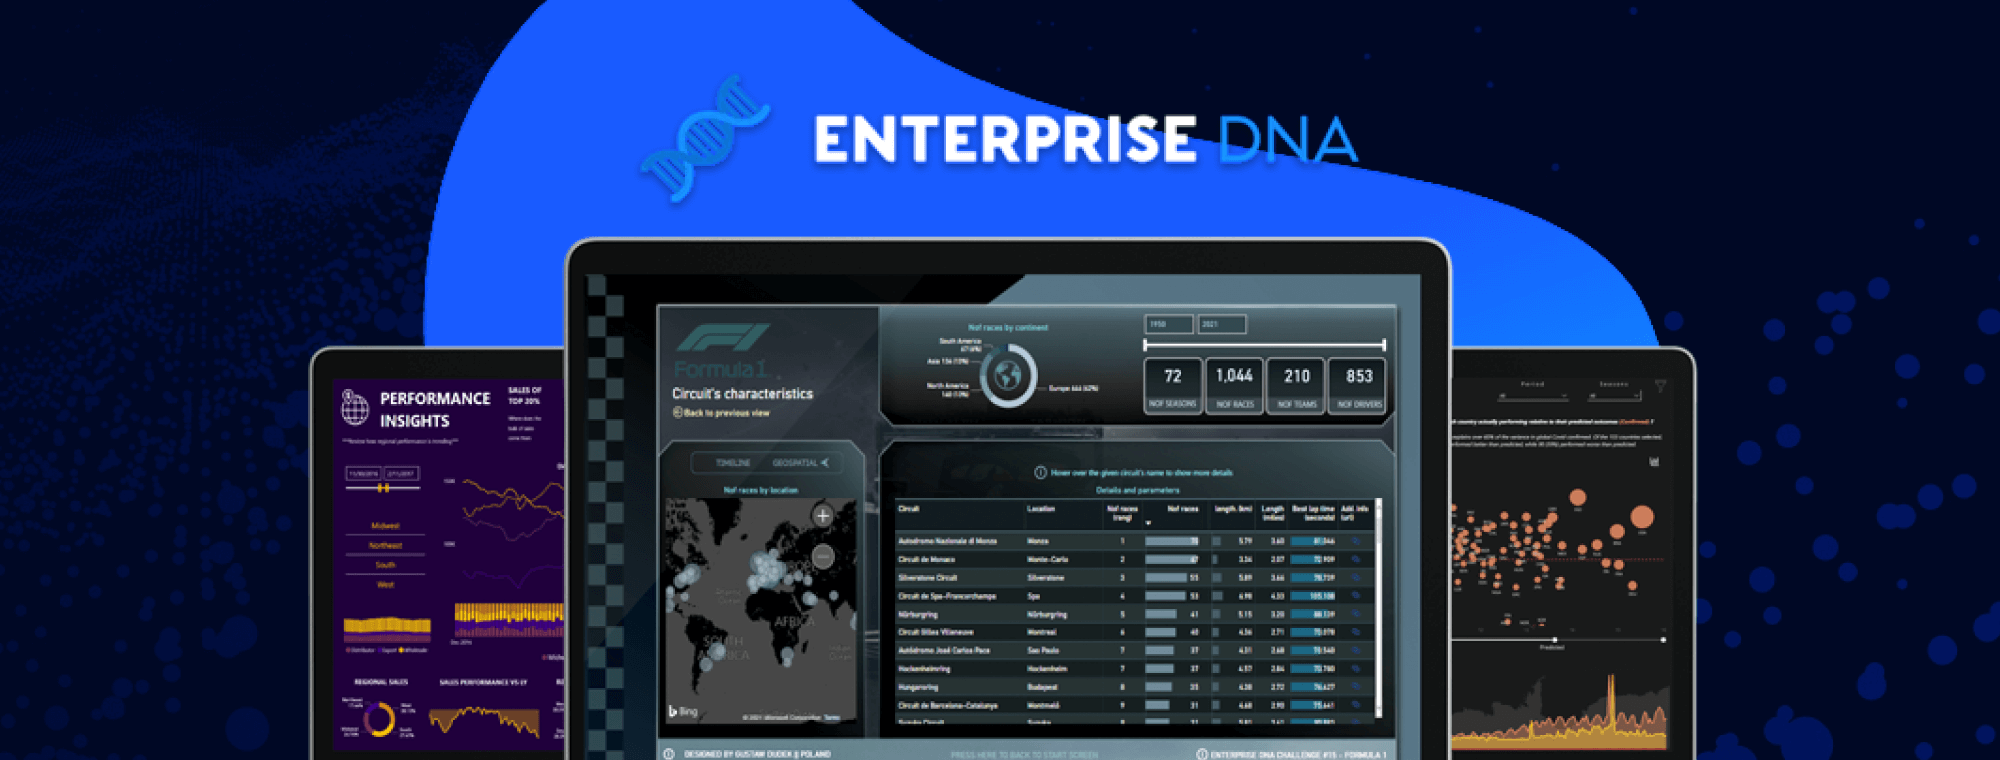
Reporting & Data Visualization Summit 2022 with Enterprise DNA
Since their Enterprise Analytics Summit in February was a huge success, Enterprise DNA is coming back with another, at least that impactful, Reporting & Data Visualization Summit 2022!
Sessions take place virtually from 23rd to 27th May and will be covered by 29 experts from all around the globe, sharing their knowledge and expertise with everyone involved. Plus, the presenters will cover every level of Power BI knowledge - so go for it, even if you're a beginner!
This event is the right fit for you if you're looking to:
- Develop compelling dashboards within Power BI using a range of analytical and visualization techniques;
- Learn how to combine crucial elements to your reporting;
- Bring your analysis and visualization techniques together.
About the session
Choosing the right chart can make or break your data. That's why Mark Leskovsek, our BI specialist is here to help you easily understand how to choose the right chart for your message.
No one should waste their time randomly inserting charts and hoping data will somehow magically present itself properly.
That is why recently, Zebra BI has developed the Zebra BI Chart Selector, an interactive tool you can use to never again have doubts about which chart type to choose for your report.
The tool became highly popular so here we are: launching a complete live session based on it.
Don't miss it!
When and where
Date: Thursday, 26th of May
Time: 1:00 - 2:00 PM CEST
Language: English
Location: Online
Organizer: Enterprise DNA
For more information and to register for the webinar, visit the official website.

 September 8th
 February 22nd