How to Add Filter Button in Power BI: 6 Key Steps for Better Analytics
PRO Trial
Power BI is a popular business analytics service provided by Microsoft. It allows users to visualize and analyze data from various sources and transform the data into meaningful insights and interactive dashboards. One of the most powerful features of Power BI is the filter option. Filters enable users to sort and manipulate data to identify key trends and patterns. This article will provide a comprehensive guide on adding a filter button in Power BI and explore advanced techniques to create interactive dashboards.
What is Power BI, and Why is it Important?
Power BI is a cloud-based business intelligence solution that enables users to connect, analyze, and visualize data from various sources. It offers various interactive tools allowing users to share insights and collaborate. Power BI is designed for businesses of all sizes and helps organizations to make data-driven decisions.
One of the key benefits of Power BI is its ability to integrate with other Microsoft products, such as Excel and SharePoint. This lets users easily import data from these programs and create dynamic reports and dashboards. Additionally, Power BI offers a variety of customization options, including the ability to create custom visuals and add custom code.
With its user-friendly interface and powerful capabilities, Power BI is quickly becoming popular for businesses looking to improve their data analysis and decision-making processes.
Overview of Power BI Filters
Filters in Power BI are used to refine data and perform advanced analysis. They allow users to focus on specific aspects of data and hide irrelevant information. Filters can be applied to individual visualizations or entire pages.
Power BI has several filters, including visual, page, and report-level filters. Visual-level filters apply to a single visualization, page-level filters allow for control of multiple visualizations on a single page, and report-level filters affect all the visualizations and pages in the report.
Visual-level filters in Power BI are highly customizable and allow users to filter data based on specific criteria. For example, users can filter data based on date ranges, categories, or specific values. On the other hand, page-level filters allow users to control multiple visualizations on a single page. This is useful when users want to compare data across different visualizations on the same page.
Report-level filters in Power BI are the most powerful type of filter, as they affect all the visualizations and pages in the report. This means that users can apply a filter once, and it will be applied to all the visualizations and pages in the report. Report-level filters are useful when users want to analyze data across multiple pages or visualizations in the report.
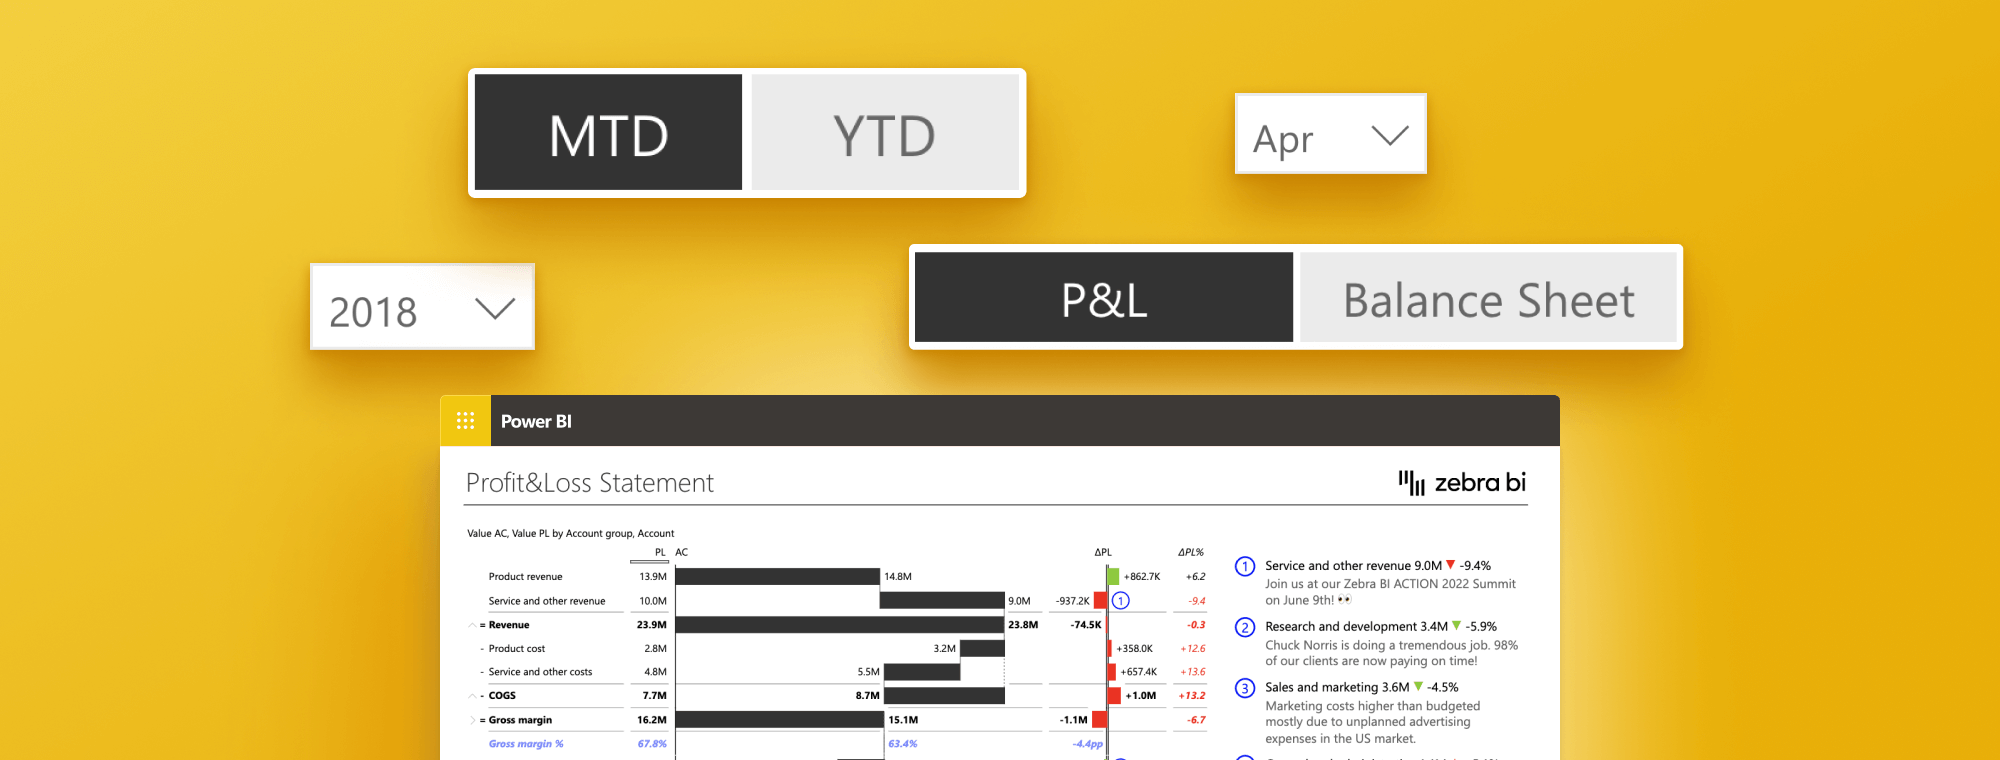
Try Zebra BI custom visuals for Power BI
Zebra BI combines the most intuitive visualization tools to take your Power BI reports to the next level and deliver insight from your data in record time.
Types of Filter Buttons in Power BI
Power BI's filtering abilities are an essential part of its data analysis capabilities, offering a range of filters for specific needs:
Automatic Filters
These filters are automatically added to the visual level of the filter pane when you construct a visual based on the fields the visual consists of. They streamline data display adjustments, allowing for quick visual refinements.
Manual Filters
Manual filters, which can be placed into any section of the filter pane while editing a report, offer extra customization, permitting the inclusion or exclusion of specific data in visuals.
Advanced Filters
Advanced filters in Power BI encompass several types:
Include and Exclude Filters: They allow for precise data point selection for inclusion or exclusion in reports.
Drill-down Filters: These filters provide a deeper look into hierarchical data, enabling a detailed breakdown from general to specific data.
Cross-drill Filters: Allow navigation across different levels of data within the same visual.
Drill-through Filters: Enable focusing on a specific entity in a report and drilling through from another page.
URL Filters: These allow for creating hyperlinks that navigate to a report with specific filter settings.
Power BI users can significantly enhance their data analysis and report generation processes by clearly understanding and efficiently applying these filters.
Add a Filter Button in Power BI: Step-by-Step Guide
Adding a filter button in Power BI is easy and requires only a few simple steps:
1. In Power BI Desktop, select the Report icon.
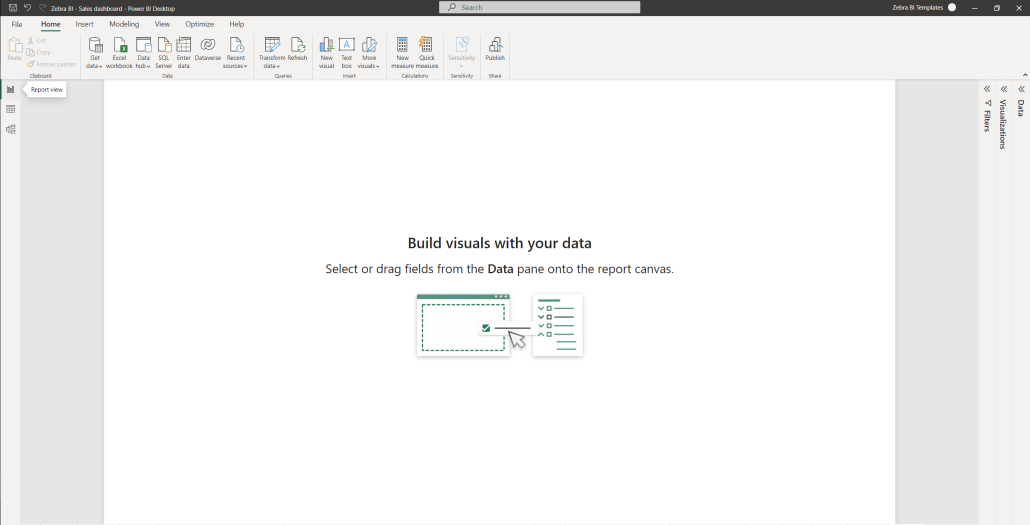
2. the Filters pane displays along the right side of the report canvas. If you don't see the Filters pane, select the ">" icon from the upper-right corner to expand it.
3. Open the Visualizations, Filters, and Data panes if not already open.
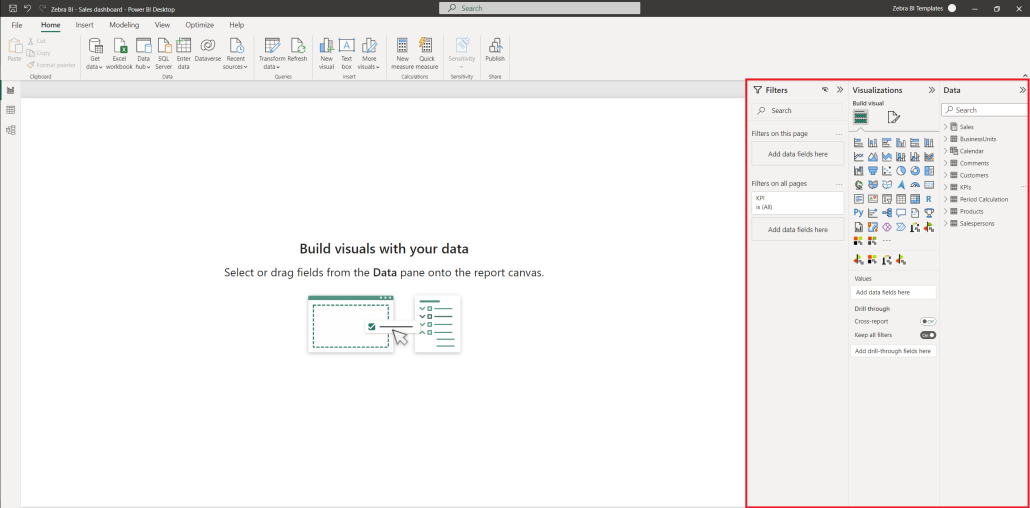
4. Select a visual to make it active.
5. From the Data pane, select the field you want to add (if not already added) as a new-level filter
6. Drag it to Filters on this visual pane:
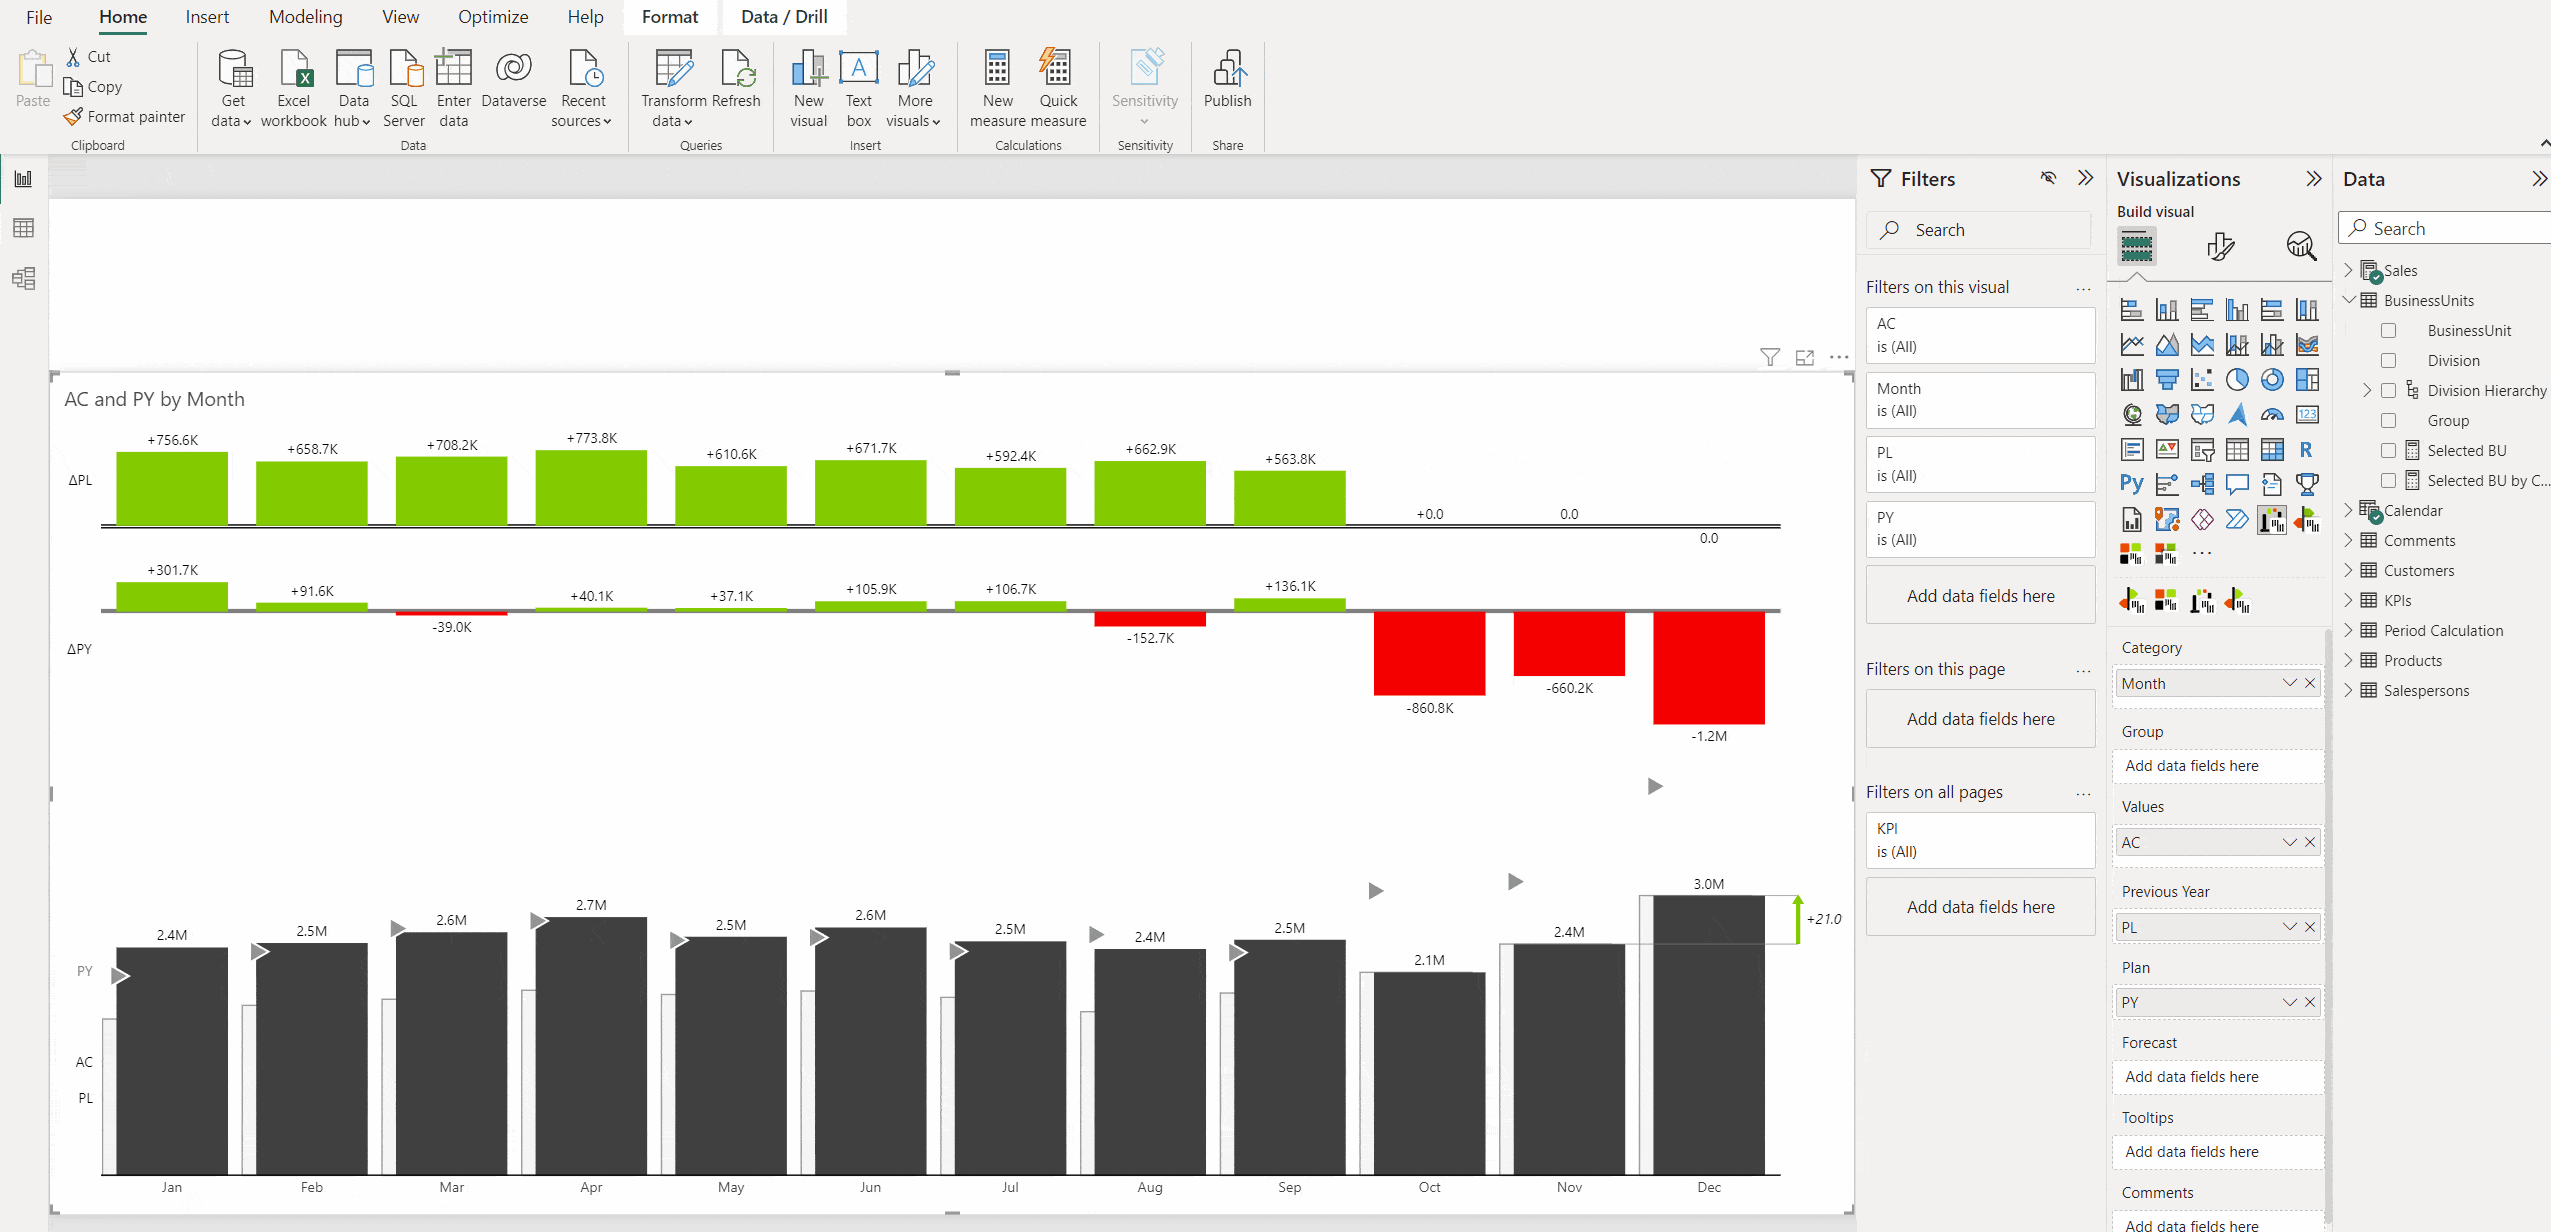
If you want to apply a filter on the entire page, drag it to the Filters on this page pane.
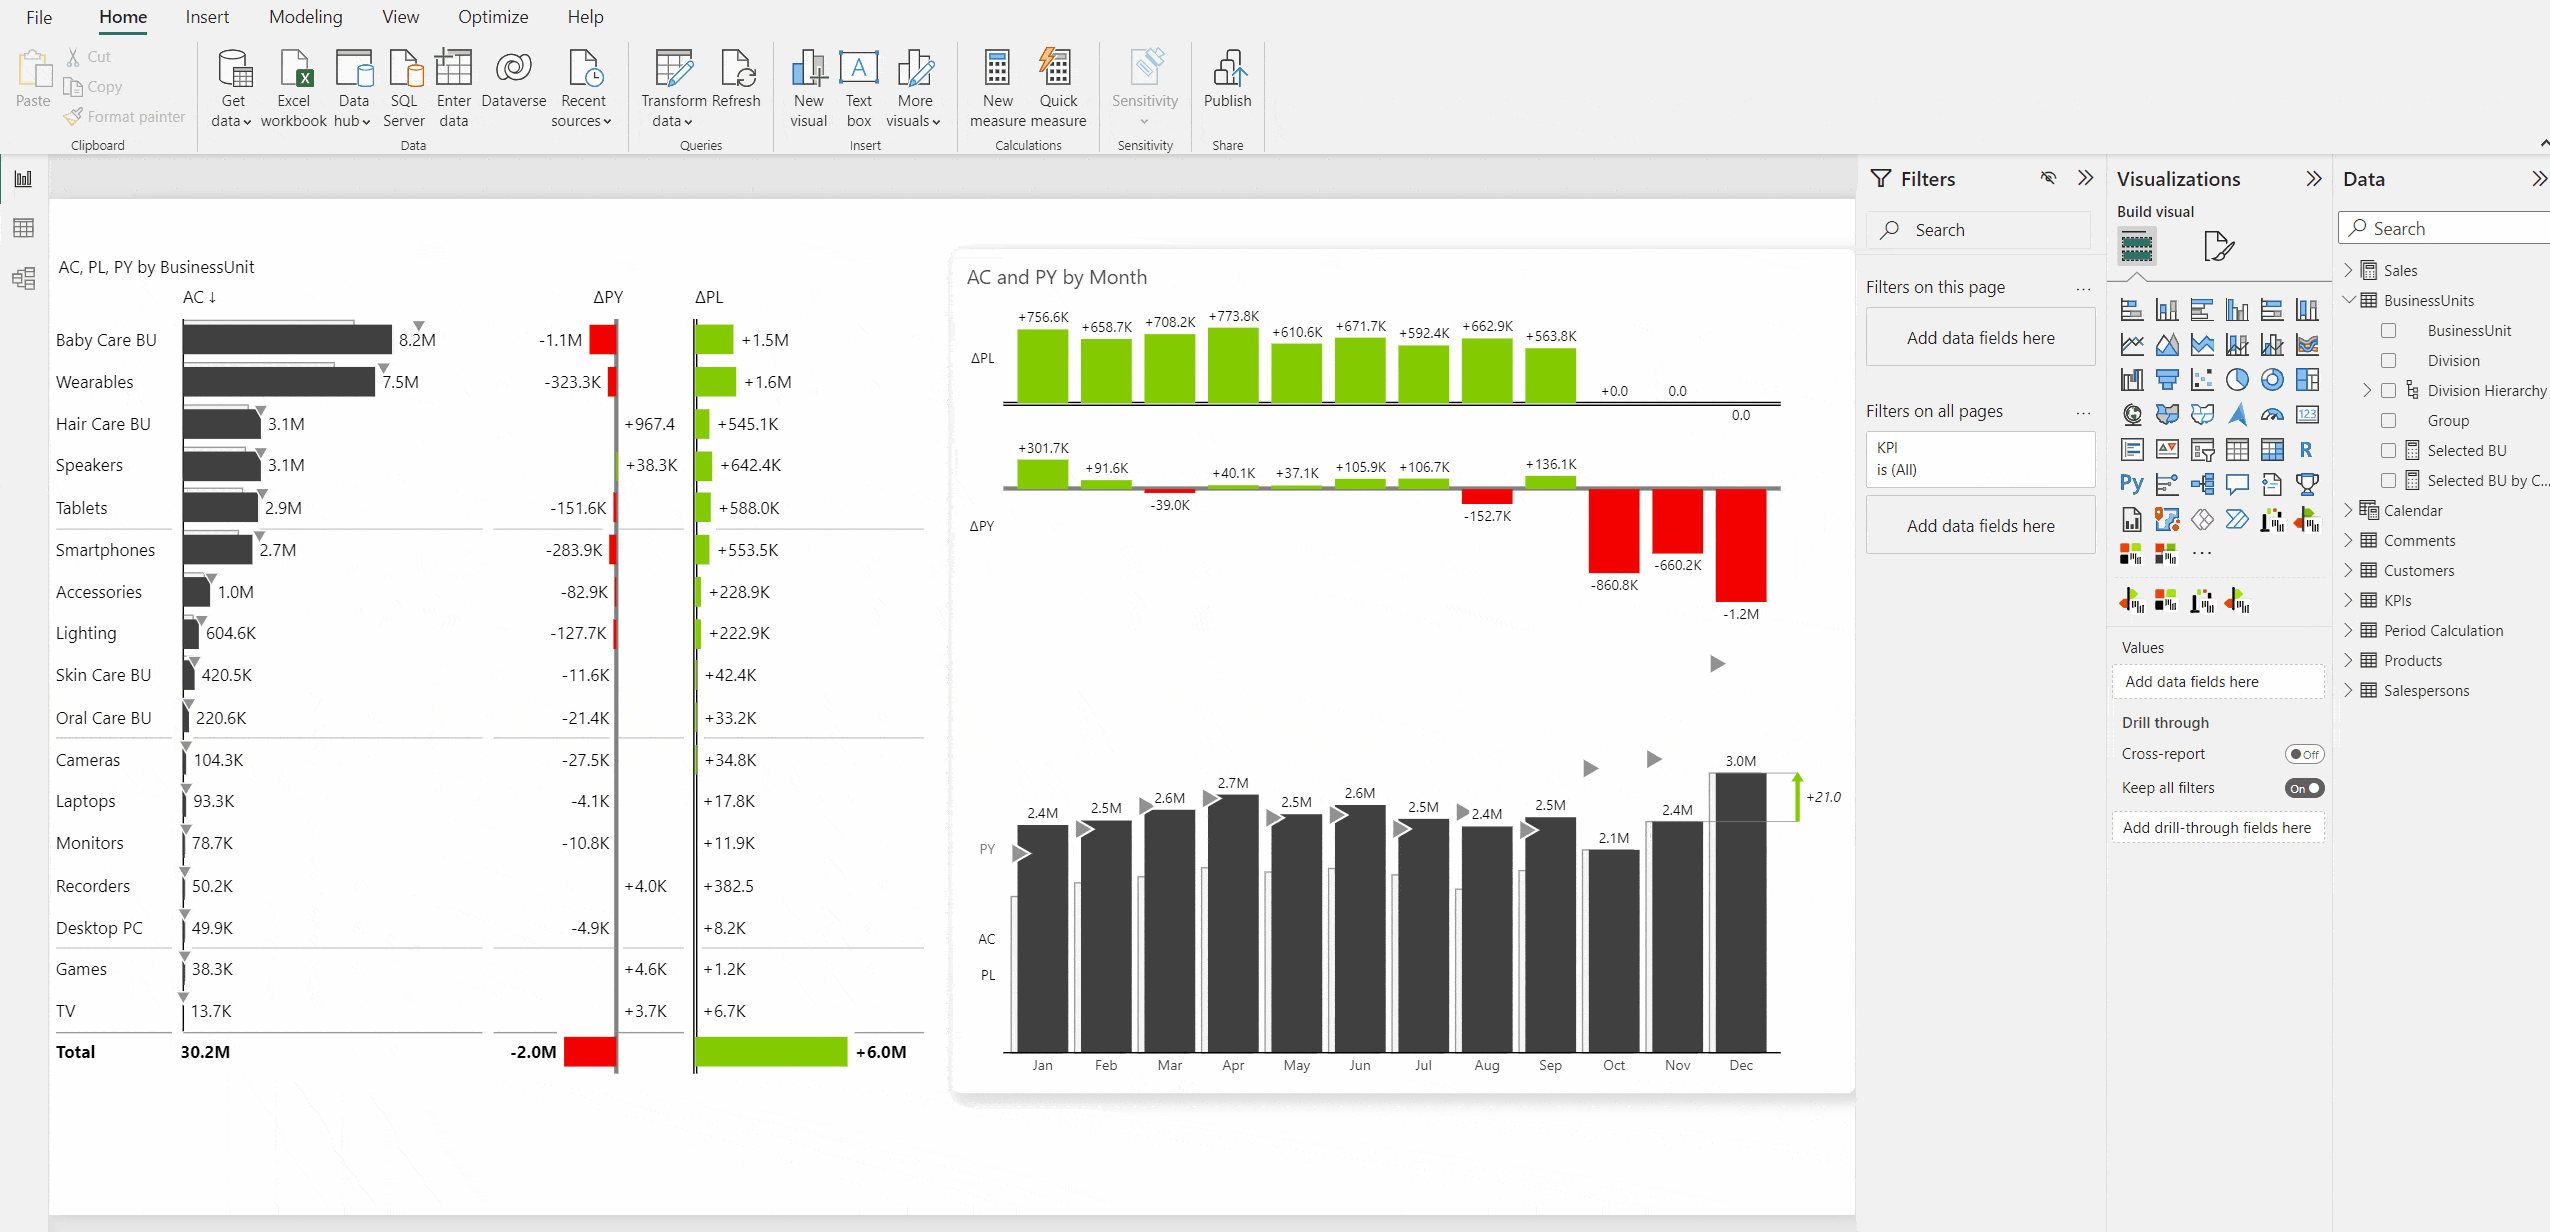
If you want to apply a filter on the entire report, drag it to the Filters on all pages pane.
It's important to note that adding a filter button can greatly enhance the user experience of your Power BI report. Allowing users to filter data independently allows them to gain deeper insights and make more informed decisions.
Additionally, you can add multiple filter buttons to a single report, giving users even more control over their viewing data. So, don't hesitate to add filter buttons to your Power BI reports and take your data analysis to the next level!
How to Customize Your Filter Button in Power BI
Customizing your filter button in Power BI allows you to control its appearance and functionality. Here are some of the ways you can customize your filter buttons:
- Change the filter type
- Change the filter layout
- Change the data type of the filter
- Add a title to the filter
- Change the color of the filter button
- Modify the size of the filter button
You can customize the filter button icon by selecting built-in icons or uploading your custom icon. This can help to make your filter button more visually appealing and easier to identify for users. Furthermore, you can also add a tooltip to the filter button, which provides users with additional information about the filter when they hover over it.
These customization options can help to improve the overall user experience and make your Power BI reports more effective.
Tips for Using Filters Effectively in Power BI Dashboards
Using filters effectively in Power BI dashboards can help you to uncover meaningful insights and identify key trends. Here are some tips for using filters effectively in Power BI dashboards:
- Start with a clear objective
- Choose the right type of filter
- Use cascading filters
- Explore advanced filtering options
- Use filter groups to organize large sets of data
Another important tip for using filters effectively in Power BI dashboards is to review and update your filters regularly. As your data changes and evolves, your filters may need to be adjusted to ensure you still capture the most relevant information. Additionally, it's important to consider the user experience when using filters. Ensure your filters are intuitive and easy to use, and provide clear instructions or guidance if necessary.
Regularly reviewing and optimizing your filters ensures that your Power BI dashboards continue to provide valuable insights and drive informed decision-making.
Common Issues with Filter Buttons in Power BI and How to Fix Them
While using filters in Power BI, you may encounter some common issues. Here are some of the common issues with filter buttons in Power BI and how to fix them:
- Filters not working as expected
- Blank values in the filter dropdown
- Filter overlapping with other visualizations
- Data not updating when the filter is changed
- Filters not displaying values in the desired format
Often, issues with filter buttons in Power BI can be traced back to your dataset. Ensuring the integrity of your data by checking for missing values, errors and verifying data types can mitigate these problems. When filters overlap with other visualizations, select the filter and drag it to a more suitable location or adjust its size for a cleaner view.
Advanced Techniques for Filtering Data in Power BI
One of the most powerful techniques for filtering data in Power BI is using slicers. Slicers allow you to filter data more interactively by providing a visual interface that users can use to select the data they want to see. Slicers can be used with any data type, including text, dates, and numbers.
Try our interactive demo to see the slicers in action — you can also download the PBIx file.
Another advanced technique for filtering data in Power BI is cross-filtering. Cross-filtering allows you to filter data in one visual based on the selection in another visual. This is particularly useful when you have multiple visuals on a page and want to filter them all based on a single selection.
Play with this interactive Power BI report to see cross-filtering in action:
Best Practices for Designing Interactive Dashboards with Filter Buttons in Power BI
Designing effective and interactive dashboards is essential to provide meaningful insights to users. Here are some best practices for designing interactive dashboards with filter buttons in Power BI:
- Use a consistent layout
- Keep it simple and avoid clutter
- Use clear and meaningful titles for the filters
- Use colors and icons to highlight important information
- Ensure that the filters work as expected
Integrating Multiple Filters on a Single Page in Power BI
Integrating multiple filters on a single page in Power BI can be challenging. Here's how you can integrate multiple filters on a single page in Power BI:
- Use slicers
- Use visual-level filters
- Use bookmarks to manage filter combinations
How to Manage and Maintain Your Filter Buttons in Power BI
Maintaining and managing your filter buttons in Power BI is essential to ensure smooth functionality. Here are some tips for managing and maintaining your filter buttons:
- Regularly check the filters for errors or issues
- Ensure that the filters are working as expected
- Create backups of the report
- Organize filters into groups
- Update the filters as per changes in the data
Getting the Most Out of Your Data with Filter Buttons in Power BI
Using filter buttons effectively in Power BI can help you to gain valuable insights and make data-driven decisions. Here's how you can get the most out of your data with filter buttons in Power BI:
- Start with clear objectives and questions
- Use different types of filters to explore different aspects of data
- Combine multiple filters for deeper insights
- Use custom filters to refine your analysis
- Ensure that the filters are updated regularly
Leveraging Power BI's filtering capabilities can substantially enhance your data analysis and reporting process. However, consider integrating Zebra BI's visuals into your Power BI reports to unlock your data's potential.
Zebra BI's visuals are fully compatible with native Power BI functions, including slicers and filters. This compatibility ensures you can enjoy the intuitive and interactive nature of Power BI's filtering while benefiting from Zebra BI's powerful, data-driven visuals that deliver in-depth insights in a clear, concise format.
To fully understand the benefits of this integration, we encourage you to test the filtering options on various Zebra BI templates for Power BI. Explore the myriad of possibilities that the combination of Power BI and Zebra BI offers and take your data analysis to the next level.
In conclusion, adding filter buttons in Power BI is a powerful tool for creating interactive dashboards and gaining meaningful insights from data. By following this comprehensive guide, you can create effective filter buttons in Power BI and gain a deeper understanding of your data.
Transform Your Reports with Zebra BI and Power BI
Experience the synergy of Zebra BI's dynamic visuals integrated with Power BI's powerful filters. See your data in a new light.