Understanding Business Insights: The Ultimate KPI Cheat Sheet
PRO Trial
Step into the world of Key Performance Indicators (KPI) with Zebra BI's Ultimate KPI Cheat Sheet—an easy-to-use resource for achieving strategic goals and improving operating efficiency. It strips down the complexities of KPIs across diverse industries, offering a clear, actionable guide to measuring and driving business success.
Key Performance Indicators (KPI or KPIs) guide strategic decision-making and operational improvement. They serve as quantifiable metrics that allow businesses to track their progress toward achieving specific goals and objectives.
We at Zebra BI have crafted this indispensable resource for professionals across industries: The Ultimate KPI Cheat Sheet. This thorough cheat sheet demystifies KPIs, providing actionable insights for business success.
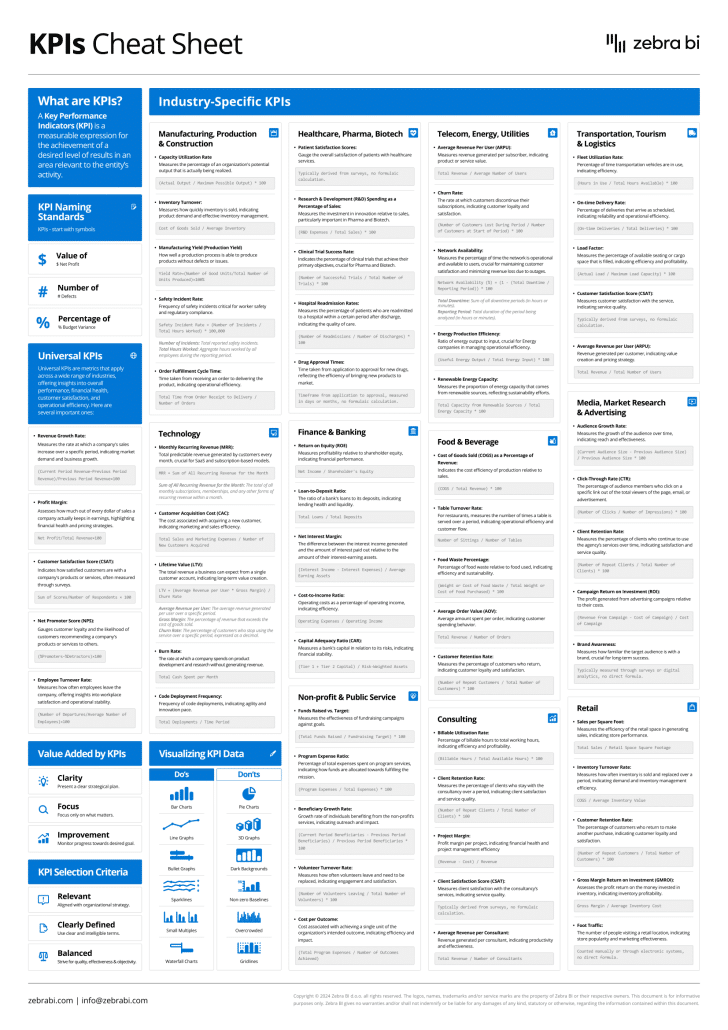
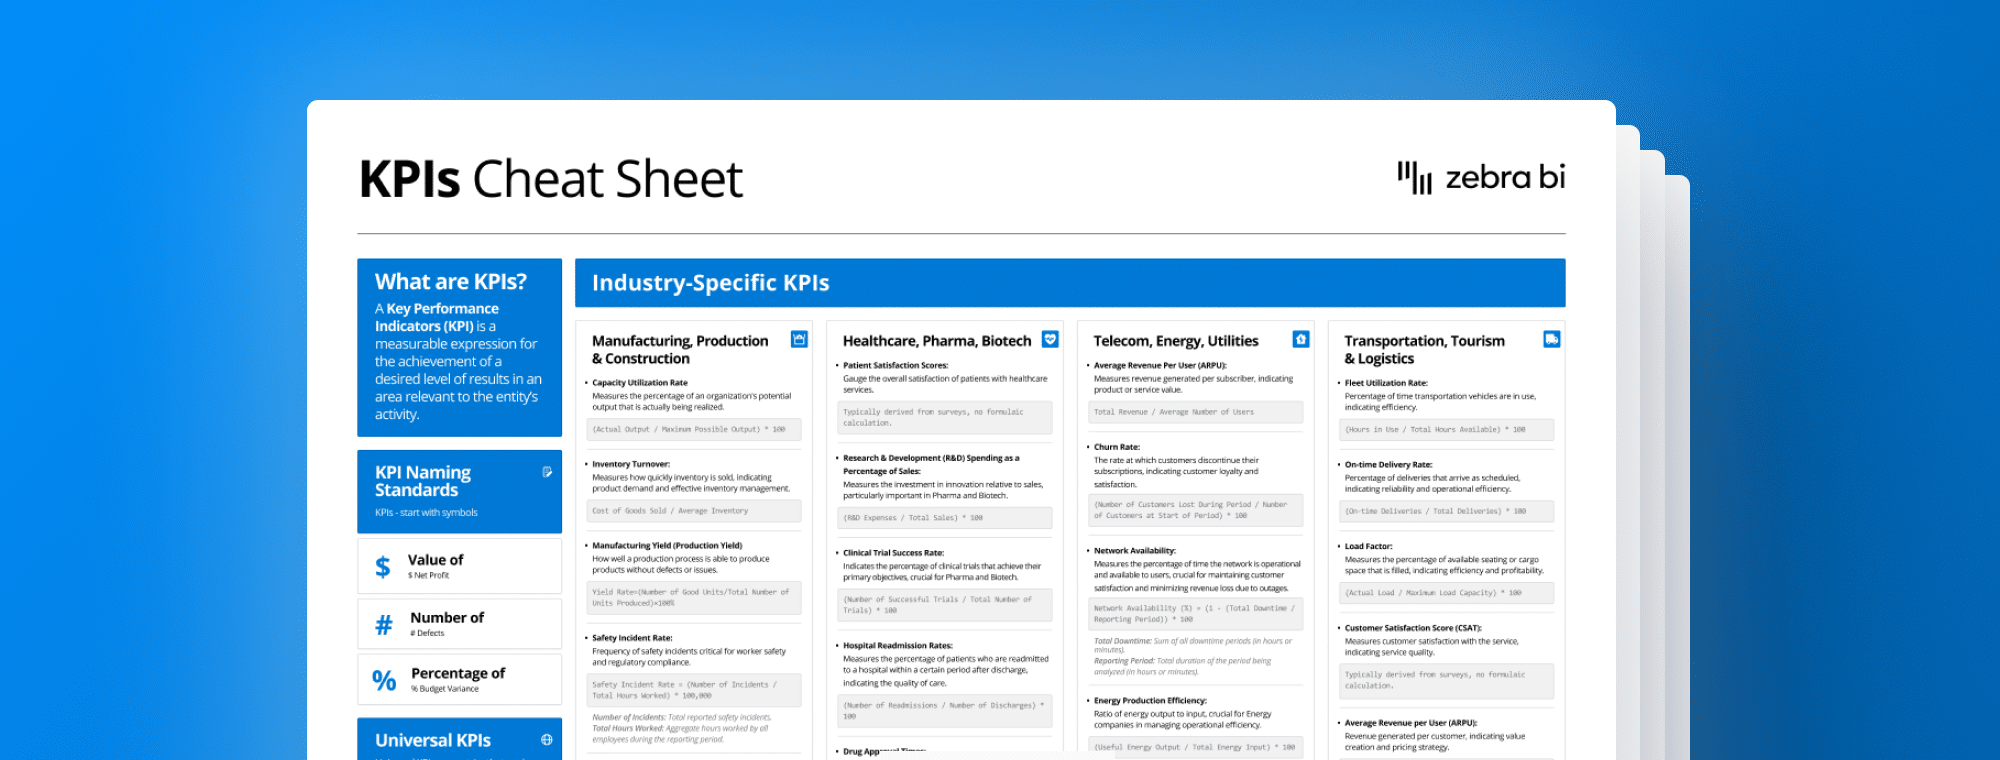
Universal KPIs
Universal KPIs are metrics that apply across a wide range of industries, offering insights into overall performance, financial health, customer satisfaction, and operational efficiency. Here are several important ones:
Revenue Growth Rate: Measures the rate at which a company's sales increase over a specific period, indicating market demand and business growth.
(Current Period Revenue−Previous Period Revenue)/Previous Period Revenue×100
Profit Margin: Assesses how much out of every dollar of sales a company actually keeps in earnings, highlighting financial health and pricing strategies.
Net Profit/Total Revenue×100
Customer Satisfaction Score (CSAT): Indicates how satisfied customers are with a company's products or services, often measured through surveys.
Sum of Scores/Number of Respondents×100Sum of Scores/Number of Respondents×100
Net Promoter Score (NPS): Gauges customer loyalty and the likelihood of customers recommending a company's products or services to others.
(%Promoters−%Detractors)×100
Employee Turnover Rate: Measures how often employees leave the company, offering insights into workplace satisfaction and operational stability.
(Number of Departures/Average Number of Employees)×100
Industry-specific insights
Recognizing the distinct challenges and goals of different sectors, the cheat sheet spotlights the top 5 KPIs for key industries served by Zebra BI. This tailored approach provides invaluable insights into industry-specific performance metrics.
Healthcare, Pharma, Biotech
Patient Satisfaction Scores: Gauge the overall satisfaction of patients with healthcare services.
Typically derived from surveys, no formulaic calculation.
Research & Development (R&D) Spending as a Percentage of Sales: Measures the investment in innovation relative to sales, particularly important in Pharma and Biotech.
(R&D Expenses / Total Sales) * 100
Clinical Trial Success Rate: Indicates the percentage of clinical trials that achieve their primary objectives, crucial for Pharma and Biotech.
(Number of Successful Trials / Total Number of Trials) * 100
Hospital Readmission Rates: Measures the percentage of patients who are readmitted to a hospital within a certain period after discharge, indicating the quality of care.
(Number of Readmissions / Number of Discharges) * 100
Drug Approval Times: Time taken from application to approval for new drugs, reflecting the efficiency of bringing new products to market.
Timeframe from application to approval, measured in days or months, no formulaic calculation.
Telecom, Energy, Utilities
Average Revenue Per User (ARPU): Measures revenue generated per subscriber, indicating product or service value.
Total Revenue / Average Number of Users
Churn Rate: The rate at which customers discontinue their subscriptions, indicating customer loyalty and satisfaction.
(Number of Customers Lost During Period / Number of Customers at Start of Period) * 100
Network Availability: Measures the percentage of time the network is operational and available to users, crucial for maintaining customer satisfaction and minimizing revenue loss due to outages.
Network Availability (%) = (1 - (Total Downtime / Reporting Period)) * 100
Total Downtime: Sum of all downtime periods (in hours or minutes).
Reporting Period: Total duration of the period being analyzed (in hours or minutes).
Energy Production Efficiency: Ratio of energy output to input, crucial for Energy companies in managing operational efficiency.
(Useful Energy Output / Total Energy Input) * 100
Renewable Energy Capacity: Measures the proportion of energy capacity that comes from renewable sources, reflecting sustainability efforts.
Total Capacity from Renewable Sources / Total Energy Capacity * 100
Manufacturing, Production & Construction
Capacity utilization rate: Measures the percentage of an organization's potential output that is actually being realized.
(Actual Output / Maximum Possible Output) * 100
Inventory Turnover: Measures how quickly inventory is sold, indicating product demand and effective inventory management.
Cost of Goods Sold / Average Inventory
Manufacturing yield (production yield): How well a production process is able to produce products without defects or issues.
Yield Rate=(Number of Good Units/Total Number of Units Produced)×100%
Safety Incident Rate: Frequency of safety incidents critical for worker safety and regulatory compliance.
Safety Incident Rate = (Number of Incidents / Total Hours Worked) * 100,000
Number of Incidents: Total reported safety incidents.
Total Hours Worked: Aggregate hours worked by all employees during the reporting period.
Order Fulfillment Cycle Time: Time taken from receiving an order to delivering the product, indicating operational efficiency.
Total Time from Order Receipt to Delivery / Number of Orders
Finance & Banking
Return on Equity (ROE): Measures profitability relative to shareholder equity, indicating financial performance.
Net Income / Shareholder's Equity
Loan-to-Deposit Ratio: The ratio of a bank's loans to its deposits, indicating lending health and liquidity.
Total Loans / Total Deposits
Net Interest Margin: The difference between the interest income generated and the amount of interest paid out relative to the amount of their interest-earning assets.
(Interest Income - Interest Expenses) / Average Earning Assets
Cost-to-Income Ratio: Operating costs as a percentage of operating income, indicating efficiency.
Operating Expenses / Operating Income
Capital Adequacy Ratio (CAR): Measures a bank's capital in relation to its risks, indicating financial stability.
(Tier 1 + Tier 2 Capital) / Risk-Weighted Assets
Food & Beverage
Cost of Goods Sold (COGS) as a Percentage of Revenue: Indicates the cost efficiency of production relative to sales.
(COGS / Total Revenue) * 100
Table Turnover Rate: For restaurants, measures the number of times a table is served over a period, indicating operational efficiency and customer flow.
Number of Sittings / Number of Tables
Food Waste Percentage: Percentage of food waste relative to food used, indicating efficiency and sustainability.
(Weight or Cost of Food Waste / Total Weight or Cost of Food Purchased) * 100
Average Order Value (AOV): Average amount spent per order, indicating customer spending behavior.
Total Revenue / Number of Orders
Customer Retention Rate: Measures the percentage of customers who return, indicating customer loyalty and satisfaction.
(Number of Repeat Customers / Total Number of Customers) * 100
Technology
Monthly Recurring Revenue (MRR): Total predictable revenue generated by customers every month, crucial for SaaS and subscription-based models.
MRR = Sum of All Recurring Revenue for the Month
Sum of All Recurring Revenue for the Month: The total of all monthly subscriptions, memberships, and any other forms of recurring revenue within a month.
Customer Acquisition Cost (CAC): The cost associated with acquiring a new customer, indicating marketing and sales efficiency.
Total Sales and Marketing Expenses / Number of New Customers Acquired
Lifetime Value (LTV): The total revenue a business can expect from a single customer account, indicating long-term value creation.
LTV = (Average Revenue per User * Gross Margin) / Churn Rate
Average Revenue per User: The average revenue generated per user over a specific period.
Gross Margin: The percentage of revenue that exceeds the cost of goods sold.
Churn Rate: The percentage of customers who stop using the service over a specific period, expressed as a decimal.
Burn Rate: The rate at which a company spends on product development and research without generating revenue.
Total Cash Spent per Month
Code Deployment Frequency: Frequency of code deployments, indicating agility and innovation pace.
Total Deployments / Time Period
Non-profit & Public Service
Funds Raised vs. Target: Measures the effectiveness of fundraising campaigns against goals.
(Total Funds Raised / Fundraising Target) * 100
Program Expense Ratio: Percentage of total expenses spent on program services, indicating how funds are allocated towards fulfilling the mission.
(Program Expenses / Total Expenses) * 100
Beneficiary Growth Rate: Growth rate of individuals benefiting from the non-profit’s services, indicating outreach and impact.
(Current Period Beneficiaries - Previous Period Beneficiaries) / Previous Period Beneficiaries * 100
Volunteer Turnover Rate: Measures how often volunteers leave and need to be replaced, indicating engagement and satisfaction.
(Number of Volunteers Leaving / Total Number of Volunteers) * 100
Cost per Outcome: Cost associated with achieving a single unit of the organization's intended outcome, indicating efficiency and impact.
(Total Program Expenses / Number of Outcomes Achieved)
Consulting
Billable Utilization Rate: Percentage of billable hours to total working hours, indicating efficiency and profitability.
(Billable Hours / Total Available Hours) * 100
Client Retention Rate: Measures the percentage of clients who stay with the consultancy over a period, indicating client satisfaction and service quality.
(Number of Repeat Clients / Total Number of Clients) * 100
Project Margin: Profit margin per project, indicating financial health and project management efficiency.
(Revenue - Cost) / Revenue
Client Satisfaction Score (CSAT): Measures client satisfaction with the consultancy’s services, indicating service quality.
Typically derived from surveys, no formulaic calculation.
Average Revenue per Consultant: Revenue generated per consultant, indicating productivity and effectiveness.
Total Revenue / Number of Consultants
Media, Market Research & Advertising
Audience Growth Rate: Measures the growth of the audience over time, indicating reach and effectiveness.
(Current Audience Size - Previous Audience Size) / Previous Audience Size * 100
Click-Through Rate (CTR): The percentage of audience members who click on a specific link out of the total viewers of the page, email, or advertisement.
(Number of Clicks / Number of Impressions) * 100
Client Retention Rate: Measures the percentage of clients who continue to use the agency’s services over time, indicating satisfaction and service quality.
(Number of Repeat Clients / Total Number of Clients) * 100
Campaign Return on Investment (ROI): The profit generated from advertising campaigns relative to their costs.
(Revenue from Campaign - Cost of Campaign) / Cost of Campaign
Brand Awareness: Measures how familiar the target audience is with a brand, crucial for long-term success.
Typically measured through surveys or digital analytics, no direct formula.
Transportation, Tourism & Logistics
Fleet Utilization Rate: Percentage of time transportation vehicles are in use, indicating efficiency.
(Hours in Use / Total Hours Available) * 100
On-time Delivery Rate: Percentage of deliveries that arrive as scheduled, indicating reliability and operational efficiency.
(On-time Deliveries / Total Deliveries) * 100
Load Factor: Measures the percentage of available seating or cargo space that is filled, indicating efficiency and profitability.
(Actual Load / Maximum Load Capacity) * 100
Customer Satisfaction Score (CSAT): Measures customer satisfaction with the service, indicating service quality.
Typically derived from surveys, no formulaic calculation.
Average Revenue per User (ARPU): Revenue generated per customer, indicating value creation and pricing strategy.
Total Revenue / Total Number of Users
Retail
Sales per Square Foot: Measures the efficiency of the retail space in generating sales, indicating store performance.
Total Sales / Retail Space Square Footage
Inventory Turnover Rate: Measures how often inventory is sold and replaced over a period, indicating demand and inventory management efficiency.
COGS / Average Inventory Value
Customer Retention Rate: The percentage of customers who return to make another purchase, indicating customer loyalty and satisfaction.
(Number of Repeat Customers / Total Number of Customers) * 100
Gross Margin Return on Investment (GMROI): Assesses the profit return on the money invested in inventory, indicating inventory profitability.
Gross Margin / Average Inventory Cost
Foot Traffic: The number of people visiting a retail location, indicating store popularity and marketing effectiveness.
Counted manually or through electronic systems, no direct formula.
Wrapping Up: Why KPIs Matter More Than Ever
KPIs translate complex data into actionable insights, enabling businesses to measure their performance against key objectives. In today's data-driven environment, understanding and leveraging KPIs is not just beneficial but essential for competitive advantage.
KPIs provide a clear view of how well a business performs, enabling managers to take proactive steps to improve results. They also provide a platform for collaboration and communication between stakeholders, ensuring everyone is on the same page.
Zebra BI's KPI Cheat Sheet is more than just a resource; it's a roadmap for navigating business analytics complexities. Whether you're a seasoned analyst or a business leader, this cheat sheet is your key to unlocking KPI potential. Embrace it to enhance your strategic decision-making and steer your business toward unparalleled success.
Discover the full potential of the Ultimate KPI Cheat Sheet on Zebra BI's website and transform your performance measurement view.