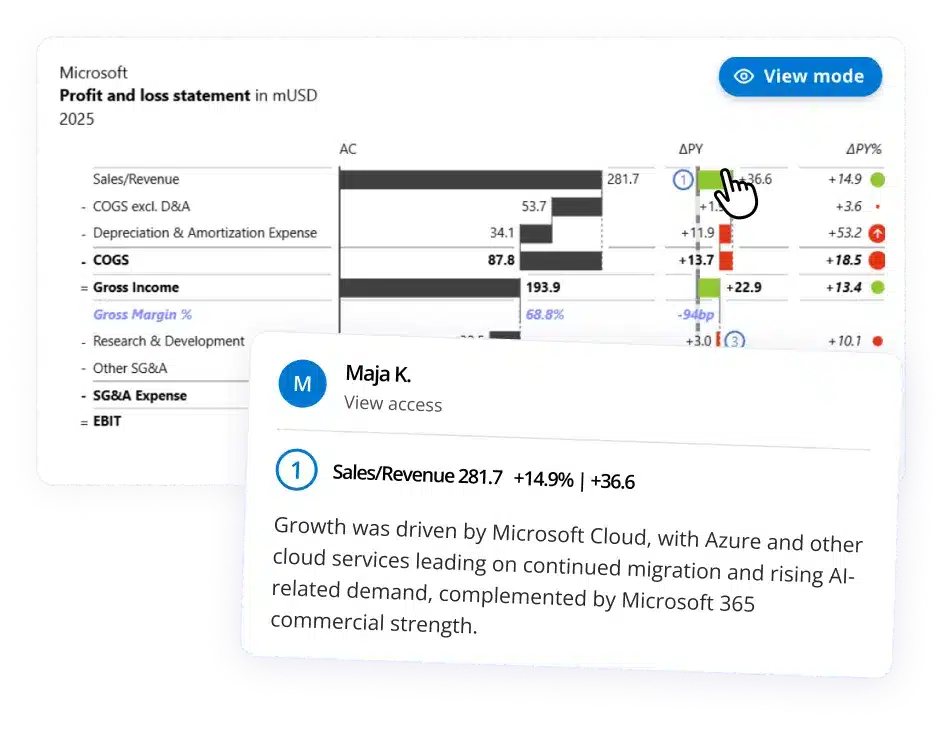
Watch the recording to learn step-by-step how to build an actionable report with Zebra BI visuals from scratch: using Zebra BI Cards, Tables & Charts.
Our BI expert Lili Alešnik showed how to present the most important KPIs and explain them in more detail with data in tables or charts. The demo was followed by an extensive Q&A session from the audience. Enjoy!
Get PBIX example
You can download the PBIX example that we used at the demo to check how it's done!
Ready to start uncovering actionable insights from your data?
Explore Zebra BI for Excel and Power BI, or start a trial instantly and test our tools on your data. You can also contact us to help you build your first test report and create a custom package for your business.

 September 8th
 February 22nd