 September 8th
 February 22nd
Microsoft income statement - FY18 Q4 financial results in Power BI
PRO Trial
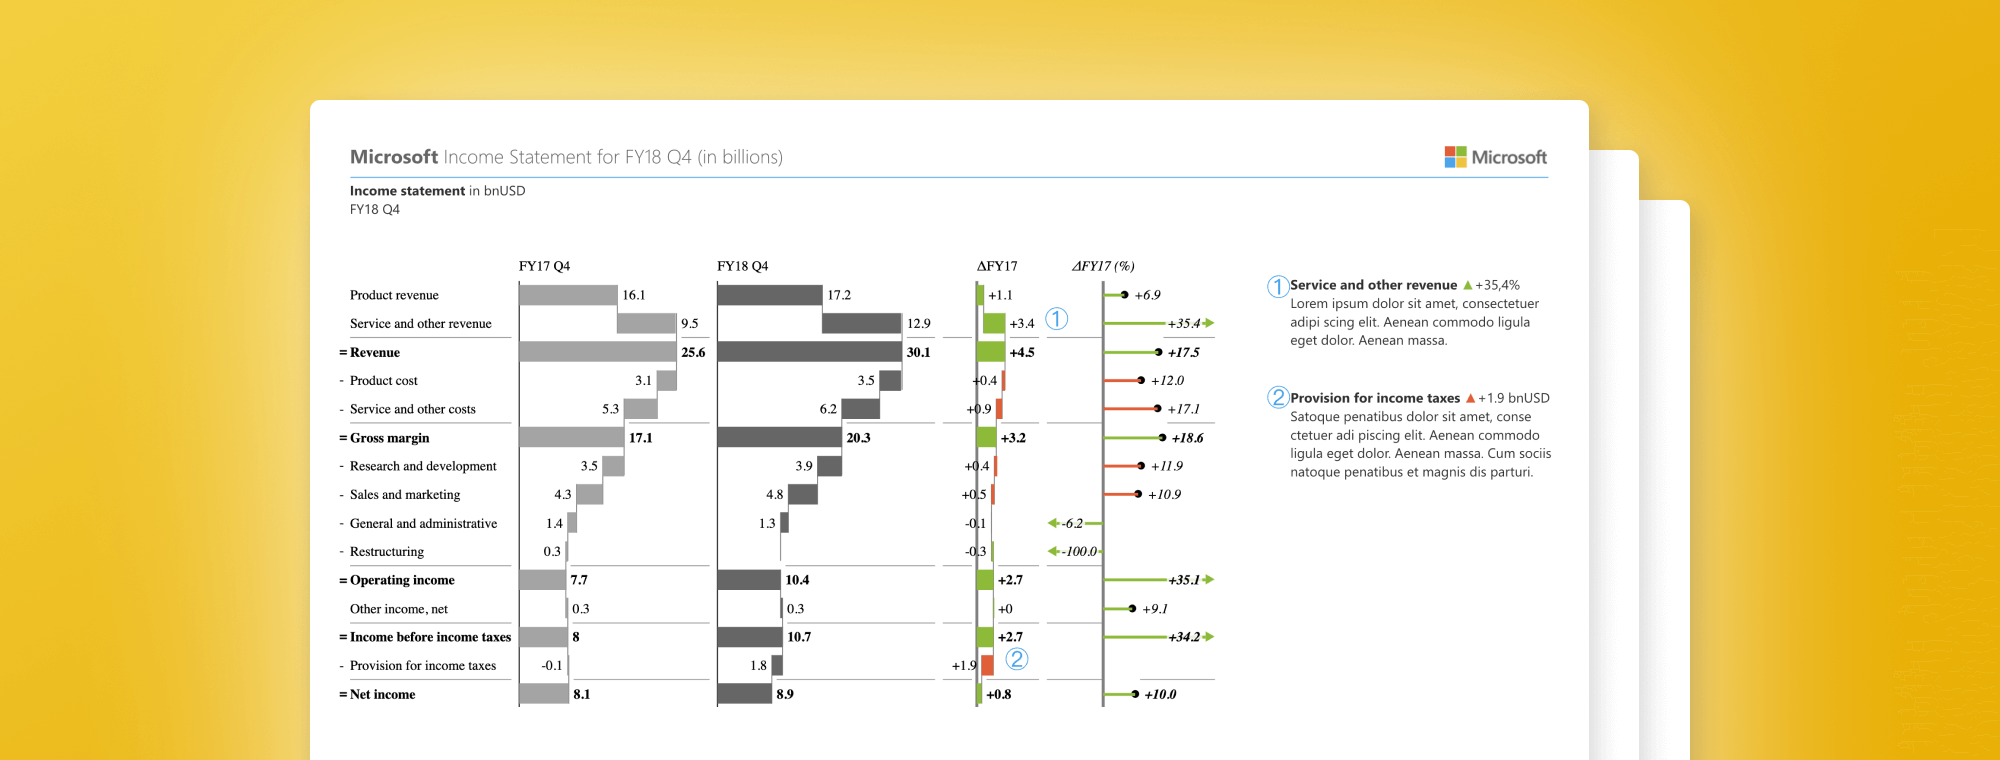
On July 19, 2018, Microsoft Corp. announced the financial results for the quarter ended June 30, 2018, as compared to the corresponding period of the last fiscal year.
The results are impressive, for example:
- Revenue was $30.1 billion and increased 17%
- Operating income was $10.4 billion and increased 35%
- Net income was $8.9 billion GAAP and $8.8 billion non-GAAP
But what caught my attention, was the fact the press release included only standard tables with additional downloadable Excel, PowerPoint, and Word documents.
So my immediate thought was, where's the Power BI presentation of these fabulous results???
So I tried to redesign the tables in an attempt to present the financial results in the clearest possible way, by leveraging the amazing Power BI capabilities, together with the advanced visualization capabilities of Zebra BI visuals for Power BI.
Alright, here we go:
What do you think? Please let me know in the comments!
Note: This is not an official presentation of Microsoft Corp. financial results. It's just a quick study of how financial data such as income statements can be visualized in a clear and understandable way in Power BI as an alternative to standard data tables.
Source: Microsoft Corp. Earnings Release FY18 Q4
Zebra BI visuals for Power BI can be downloaded by clicking below:
"Before" picture of original statements would be helpful for comparison.
I like the dynamic option I noticed in one of the slides. It would be helpful if there was a note to inform users how to use the feature. I recognized it from a PivotTable slicer, but for anyone who was not familiar with slicers they could thing that it was just static text.
As well, a "how to" blog describing how you created the makeover charts would be helpful.
Hi Ron, here's the how-to article on how to set up the overlay charts (called 'Report Page Tooltips' in Power BI): http://zebrabi.com/pbi/use-report-page-tooltips-provide-details/
Next, here you can download a PBIX example of monthly P&Ls that demonstrates all the features presented in the Microsoft makeover: http://zebrabi.com/pbi/beautiful-income-statements-power-bi/
We have a step-by-step article on how to set up Income statements in Power BI with a downloadable sample file here: http://zebrabi.com/pbi/income-statement/
Finally, you will find a 1-hour detailed webinar recording that covers this topic here: http://zebrabi.com/income-statements-power-bi-webinar/
Hope this is helpful 🙂