2025 is bound to be an amazing year for Business Intelligence. But what are the BI trends you should really keep an eye on? Read more in our article here.
Wondering how to turn your Power BI dashboards into fantastic sources of insight for your organization? Read our guide, watch our webinar, and find out more!
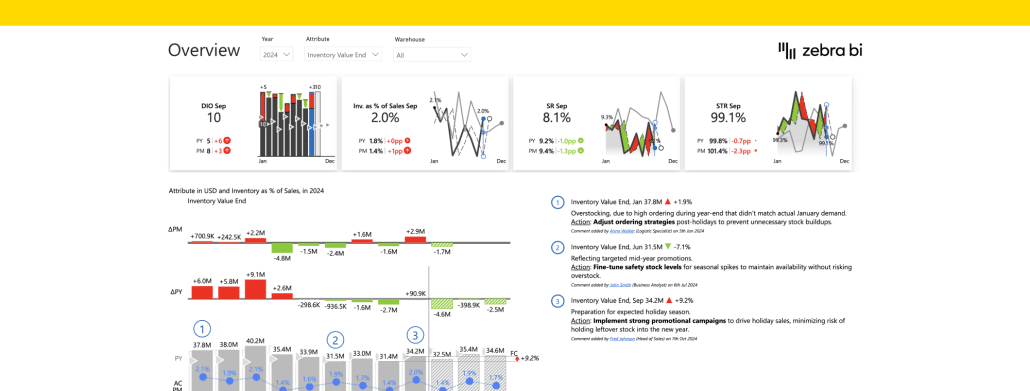
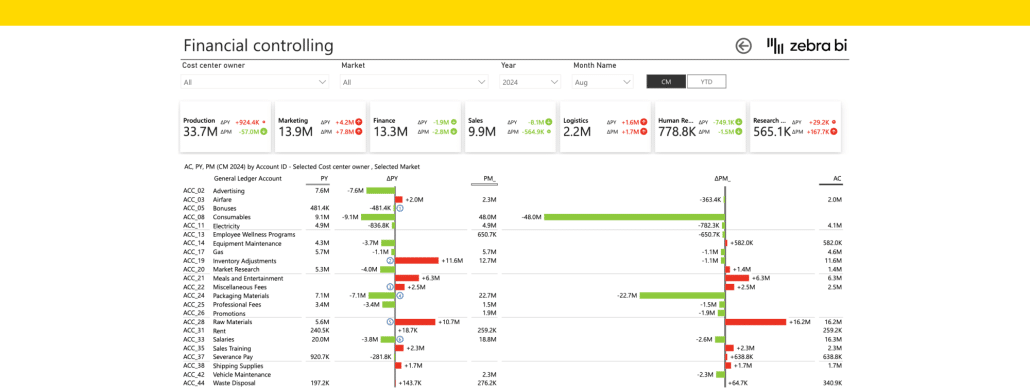
Financial Statements in Power BI can sometimes feel limitative, but that doesn't have to be the case. Here's how Zebra BI can help you turn your Power BI Financial Statements into insight powerhouses.
Power BI can be a true game-changer for organizations looking to turn their data into actionable insights. But how do you leverage it to achieve its max potential -- and how do you make handling dashboards easier, more user-friendly, and more efficient? Join our FREE webinar and find out!
Your Budget Tracking should be a North Star action across the entire organization, not just among Financial Analysts. Here's how Zebra BI can help you make this easier and more efficient.
 September 8th
 February 22nd
 05 Mar 2026