
 September 8th
 February 22nd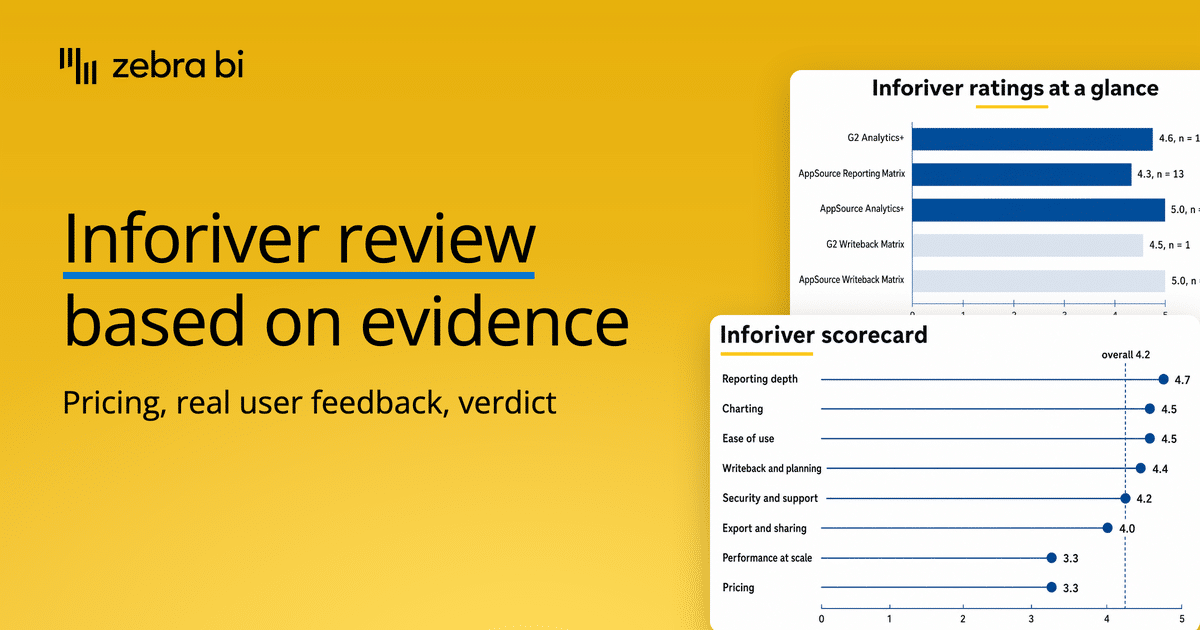
Inforiver review: Is it worth it?
Ask a Power BI finance team where the native matrix falls short and you'll hear the same answers: it can't do a clean P&L, it won't export to Excel with formatting, and every variance column needs another DAX measure.
Inforiver was built to close that gap, and it has spent 5 years becoming one of the most talked-about paid visuals in the Power BI ecosystem.
So, is Inforiver worth your money?
For this review, the sources are straight from Inforiver's own documentation, its public pricing, and a counted set of real user reviews across G2, Microsoft AppSource, and the Power BI community.
The short version: Inforiver is a deep, Excel-like reporting and analytics suite that earns most of its praise. However, there are 2 real trade-offs, around price and large-data performance, that you should price in before you buy.
Here's what the evidence says, criterion by criterion.
What is Inforiver?
Inforiver isn't a single visual. It's a set of Power BI custom visuals from Lumel, which describes itself as the top Power BI AppSource partner and reports more than 3,000 customers worldwide (source: inforiver.com, verified June 2026).
The products split into 2 groups, starting with the reporting and visualization side, the Inforiver BI Bundle:
- Reporting Matrix: the flagship. A no-code matrix for financial, management, variance, paginated, and IBCS-style reporting, with cell-level formatting and local measures.
- Analytics+: a 3-in-1 visual with 100+ chart types, KPI cards, Gantt, and tables for dashboards and data stories.
- Premium Table: a scalable, no-code table visual for larger row counts.
- Super Filter: an all-in-one slicer and filter, free on AppSource.
The planning side is the XP&A Bundle:
- Writeback Matrix: a no-code data entry and writeback to destinations including SQL Server, Azure SQL, Synapse, Fabric, Dataverse, Snowflake, Databricks, BigQuery, and SharePoint, with 3 writeback modes and column and row-level security.
- EDITable: self-service reference data management inside Power BI.
Both the Reporting Matrix and Analytics+ are Microsoft-certified visuals and IBCS-certified (source: inforiver.com, verified June 2026). That certification matters for trust, and it deserves a closer look in the security section.
Is Inforiver right for you?
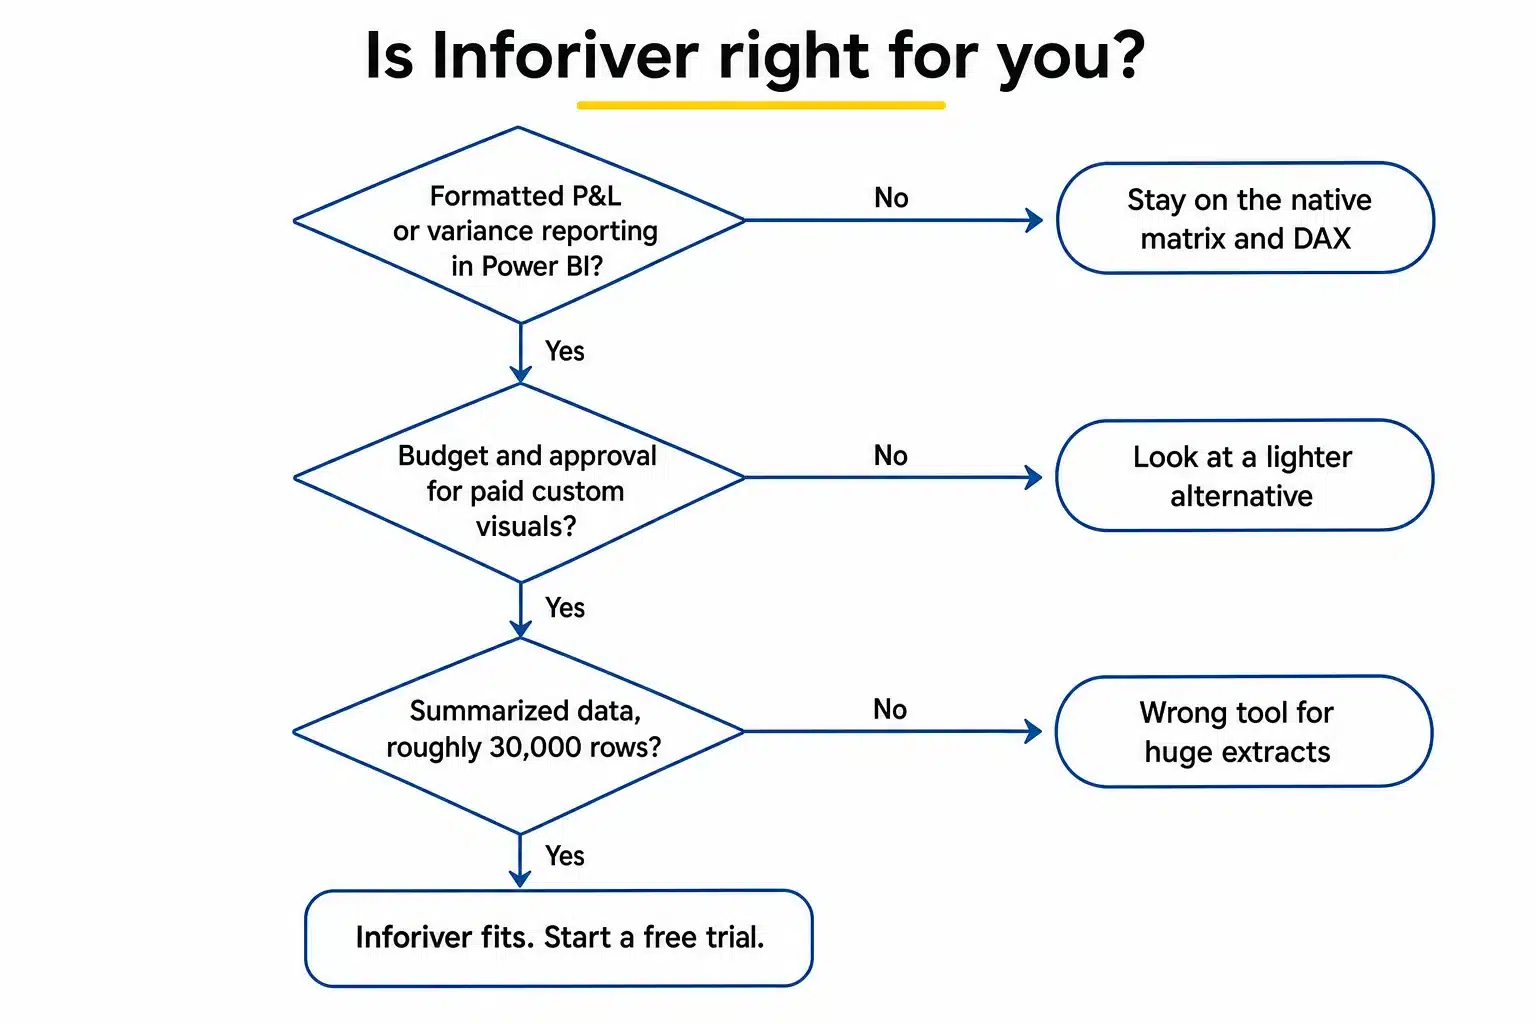
Inforiver is the right tool if you are:
- A finance or FP&A team building P&L, budget-versus-actual, or management reports in Power BI, and tired of hand-coding variances.
- A report builder replacing SSRS or paginated reports who wants Excel-grade formatting and scheduled exports.
- A team that wants data entry, planning, or writeback on top of Power BI without standing up a separate planning tool.
- An analyst who wants one visual that covers tables, cards, and 100+ chart types.
Look for an Inforiver alternative if you are:
- On a tight budget, or in an organization that won't approve paid custom visuals.
- Building extract-style reports over huge, granular datasets rather than summarized, formatted ones.
- After deep per-chart, pixel-level data visualization customization that rivals a dedicated tool like Tableau or Qlik.
What you should know before buying
A review that buries the caveats isn't worth much, so here they are first. Price is the most repeated complaint in the reviews, and large-data performance is second. One timing note: Inforiver retired its developer-based licensing in February 2024 in favor of the current, far cheaper per-user tiers (details in the Pricing section), so price complaints in older reviews were made under earlier, steeper models. Inforiver's own docs are upfront about it: the tool is built for summarized, formatted reports, not million-row extracts. While Performance Mode addresses scale, it trades away features to do it.
Exports can be slow, and KPI cards have a reported reliability bug. None of this rules Inforiver out, but it does narrow who should buy it. The quotes behind each caveat are in the deep dives below.
Inforiver pricing
Inforiver is a per-user subscription (creators, editors, and viewers all take named seats), or a domain-wide license for unlimited users quoted by company size. Pricing below comes from Inforiver's official pricing pages, captured live on 29 July 2026. The licensing model has changed twice in recent years (see the note below the table), so confirm on the live pages before you buy.
| Plan | Price (captured 29 Jul 2026) | What you get |
|---|---|---|
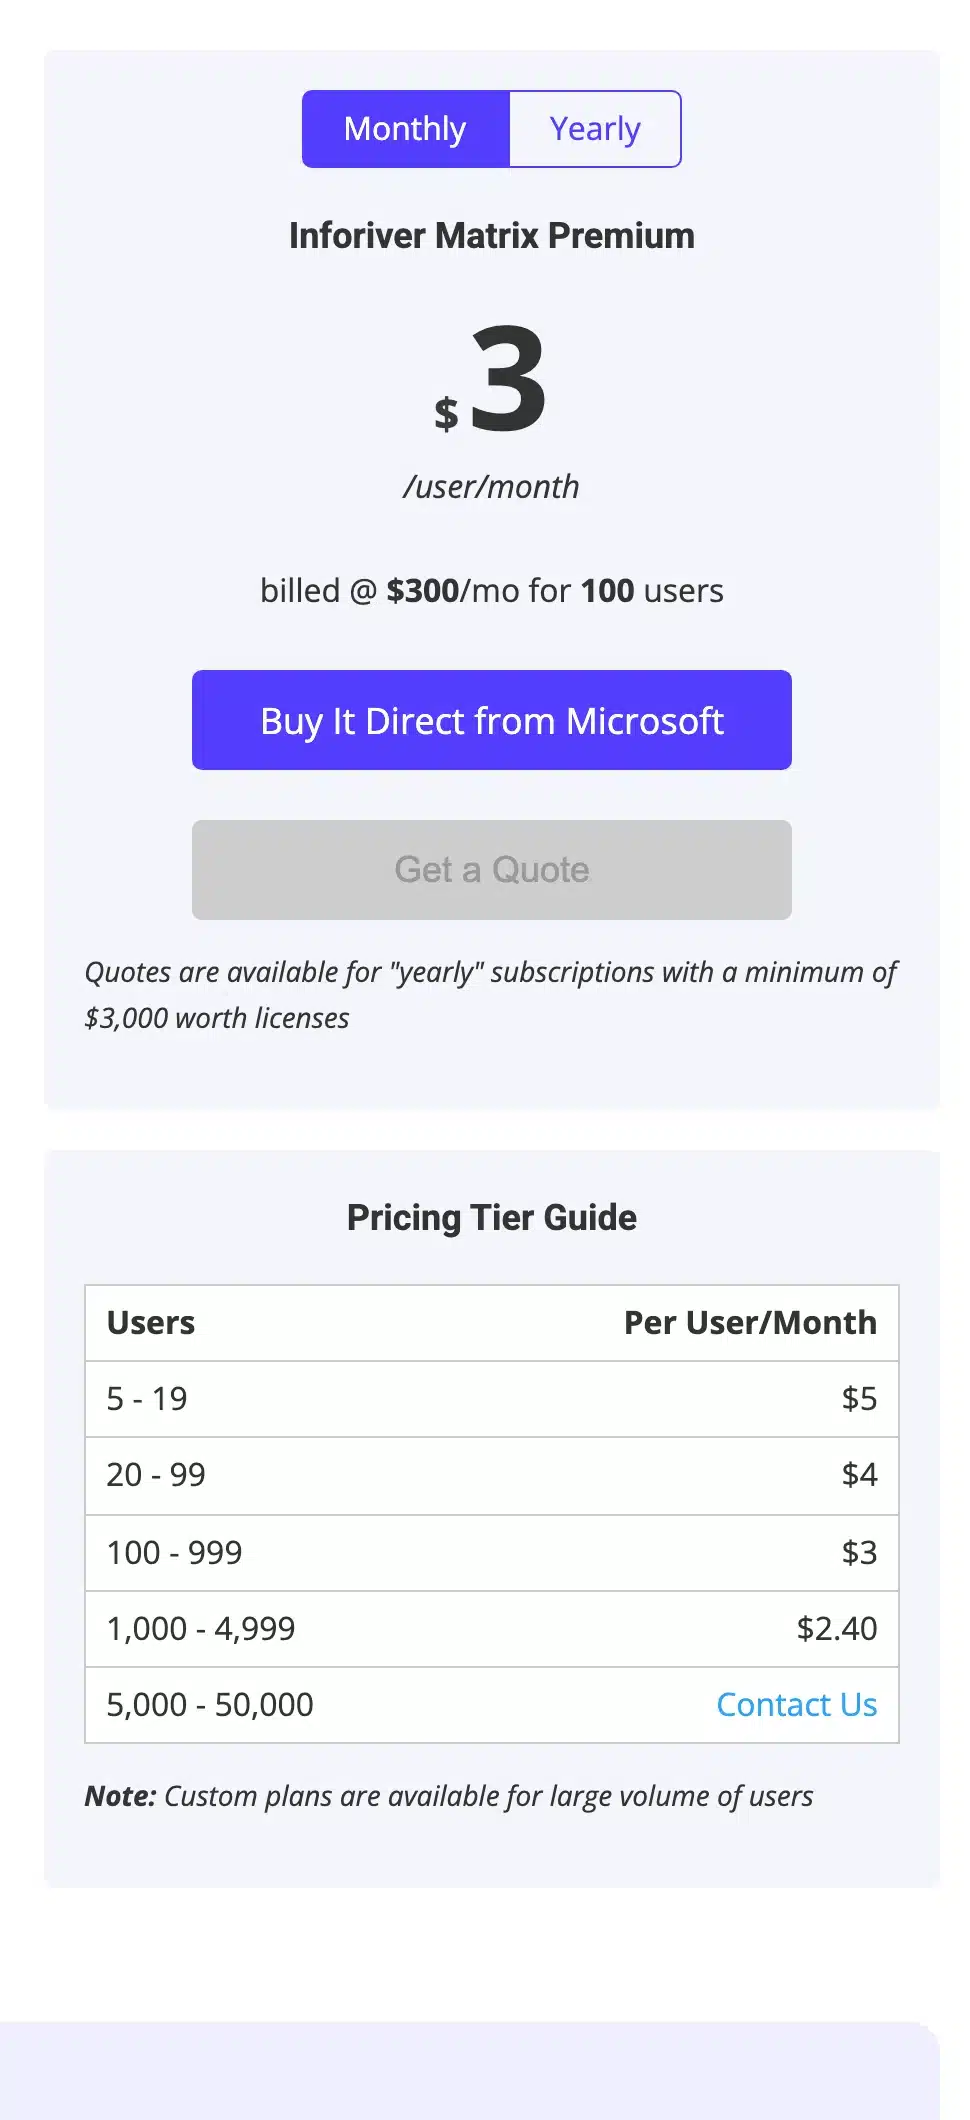
| Reporting Matrix (Matrix Premium), named users | $5 per user / month (5 to 19 users), $4 (20 to 99), $3 (100 to 999), $2.40 (1,000 to 4,999) | Monthly billing on Power BI Online Service; every creator, editor, and viewer is a named seat |
| Analytics+ suite, named users | $3 per user / month (2 to 999 users), $2.40 (1,000 to 4,999) | Monthly billing; the full 100+ chart suite |
| Domain-wide license (either product) | Contact sales; starting at $12,000 / year | Unlimited creators, editors, and viewers, priced by company size |
| Super Filter | Free | All-in-one slicer and filter on AppSource |
| Free trial | Free | Time-limited evaluation of the paid visuals |
There are 2 things missing from the price tag.
Each product is licensed on its own, so a team that wants the Reporting Matrix, Analytics+, and the Writeback Matrix is buying 3 subscriptions, not one. And every viewer needs a named seat on the per-user plans, so the cost scales with your audience, not your builders: 500 report readers on the $3 tier is $1,500 a month before anyone builds anything. Run that against the domain-wide floor; at roughly 330 named users on the $3 tier you cross $12,000 a year, which is where the domain-wide quote starts.
Note: Inforiver's licensing model has changed twice in recent years, and older price quotes mislead. Developer-based licensing rose from $150 to $245 per developer per month on 1 November 2023 (announced on Inforiver's own blog), and was then retired entirely effective February 2024; the pricing pages still carry the discontinuation notice pointing buyers to named-user or domain-wide licensing instead. The per-user tiers above replaced that model and have been stable since at least February 2025 (verified against archived copies of the pricing pages) through this 29 July 2026 capture. So if you see an older article, review, or quote citing per-developer pricing, it predates the February 2024 overhaul; the current per-seat rates are far lower per person than the retired developer rates.

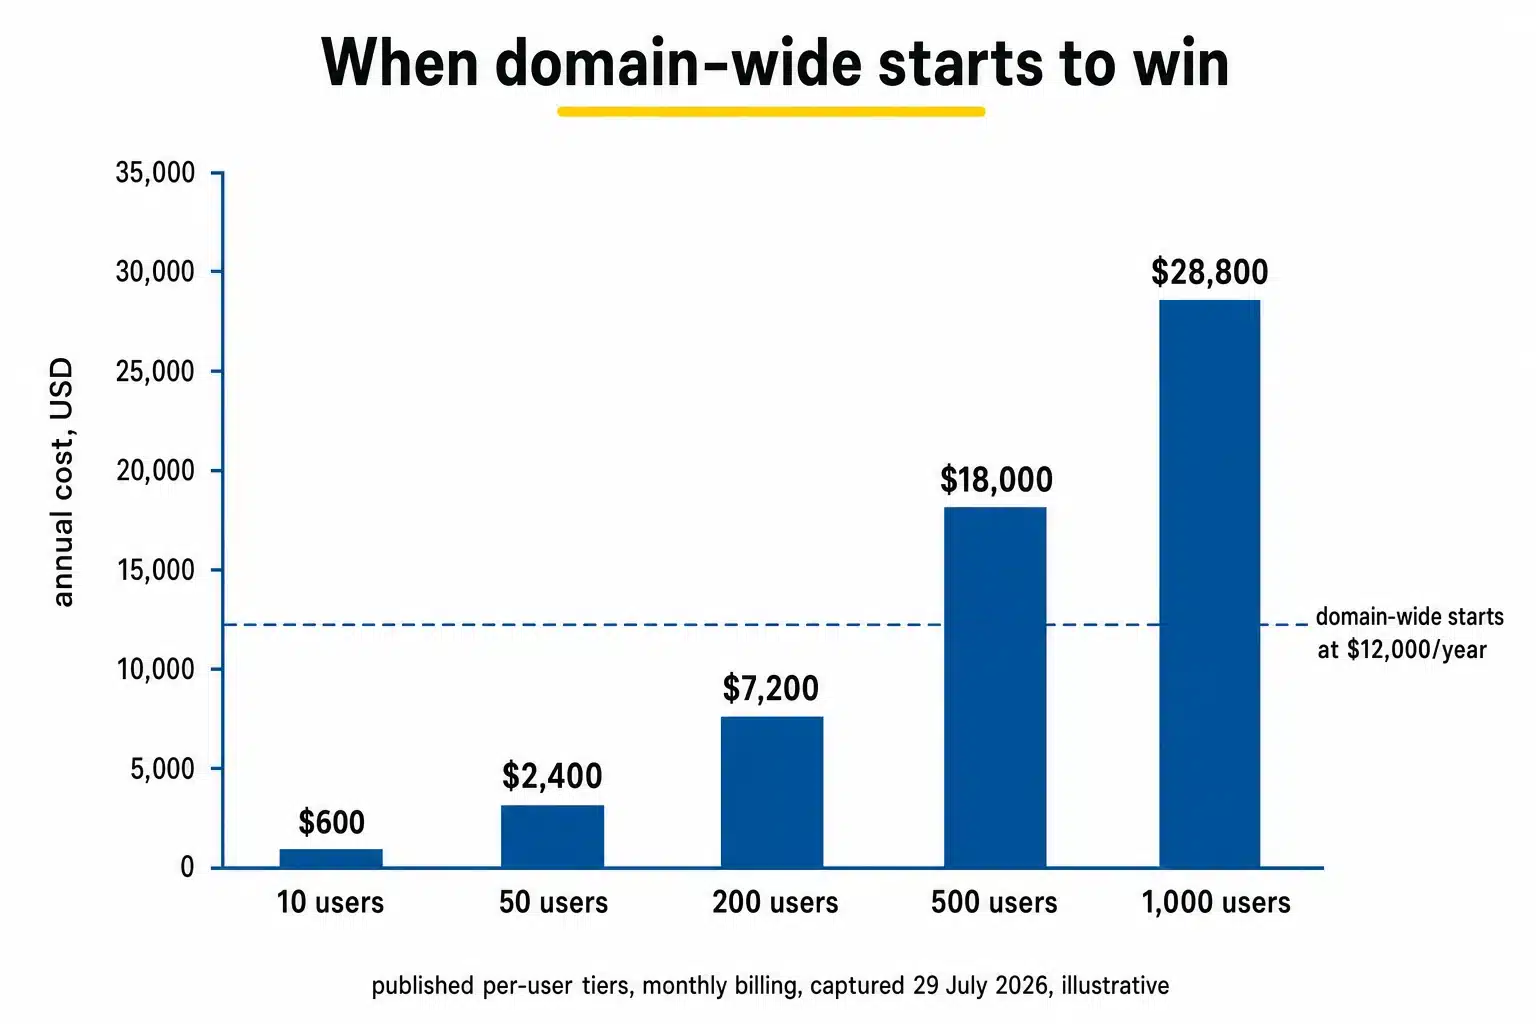
For a small team the per-user math is cheap. For a wide rollout, count your viewers first, then get a domain-wide quote.
How we evaluated this, and a disclosure
This review draws on Inforiver's official documentation and pricing, its Microsoft AppSource listings, and a counted set of real, dated user reviews: 16 G2 reviews for Analytics+, the G2 and AppSource reviews for the Writeback and Reporting matrices, and Power BI community and YouTube discussion.
The scores reflect what verified buyers consistently report, so the verdict rests on patterns across many users rather than any single opinion. The rubric is applied the same way to every dimension and weighted for a blended audience of finance teams, report builders, and general Power BI users.
Star ratings and review counts are cited from G2 and Microsoft AppSource as published facts; AppSource review text is summarized rather than reproduced verbatim, in keeping with the marketplace's content terms.
One disclosure: this review is published by Zebra BI, which makes Power BI reporting visuals that compete with Inforiver. That's exactly why it leans on Inforiver's own documentation and verbatim third-party reviews instead of our opinion. Read the quotes, check the sources, and judge for yourself.
What real buyers say about Inforiver
Inforiver's public ratings are strong. Here's the picture as of June 2026.
| Source | Rating | Reviews |
|---|---|---|
| G2 (Analytics+) | 4.6 / 5 | 16 |
| G2 (Writeback Matrix) | 4.5 / 5 | 1 |
| Microsoft AppSource (Analytics+) | 5.0 / 5 | 8 ratings |
| Microsoft AppSource (Reporting Matrix) | 4.3 / 5 | 13 ratings |
| Microsoft AppSource (Writeback Matrix) | 5.0 / 5 | 1 |
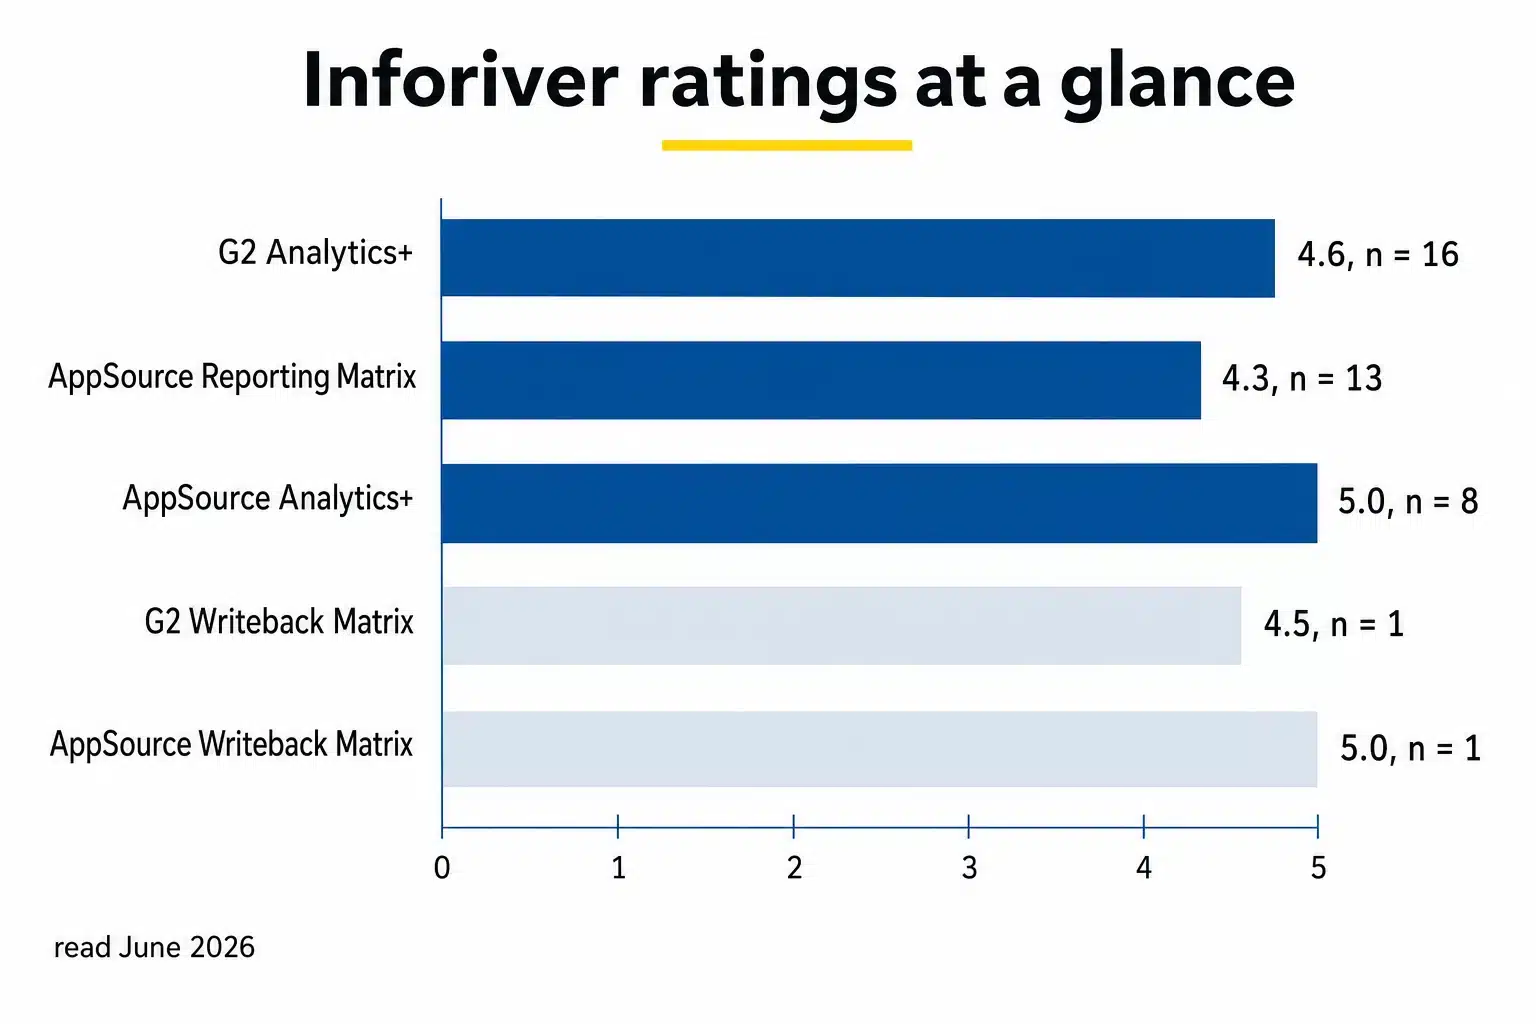
One thing to keep in mind when reading these reviews: most of the G2 reviews are marked incentivized or sourced from a G2 invite, which tends to improve averages. The AppSource and community comments are unincentivized, so we've weighted those more heavily for the critical themes. Watch the sample sizes too: 2 of the AppSource listings show perfect 5.0 averages over tiny samples (8 ratings, and a single one), which tells you less than the 13-rating Reporting Matrix average does. Taken together, the picture is consistent: people who buy Inforiver for formatted reporting tend to be very happy, and the friction lands on price, performance, and export speed.
Reporting and formatting depth: the strongest case
This is where Inforiver wins its reputation. The Microsoft AppSource reviews for the Reporting Matrix are unusually strong. One reviewer rated it the most feature-rich matrix visual on the marketplace and said nothing else compares. Another, posting in August 2022, called it the only visual that matches the customization of SSRS and Excel while keeping the performance of tabular models.
Those reviews land on the same point, and it's the core reason finance teams adopt the tool: it brings Excel and SSRS-grade formatting control into a Power BI visual, so a P&L or a variance report looks the way accountants expect rather than the way the native matrix forces. Cell-level formatting, local measures, and paginated output are the specific features behind the praise.
An independent reviewer, André of KnowledgeBank by obviEnce, made the same observation about depth back in 2021, noting the product was so feature-dense that "the development team had to implement its own ribbon because the standard properties pane for Power BI visual would simply not be able to support what this visual is able to do." The observation has only grown truer since: Inforiver's own 2025 roadmap says the Analytics+ chart library has since doubled, from 50+ to over 100 chart types (source: inforiver.com blog, May 2025, verified August 2026).
Those formatting-depth reviews date from 2021 and 2022, so weigh their age; nothing in the newer 2024 review set contradicts them, but the freshest independent praise concerns Analytics+ rather than the Reporting Matrix.
Bottom line: for financial and management reporting, Inforiver's formatting depth is closer to dedicated reporting tools than to other Power BI visuals, and the user evidence backs that up.
Inforiver's charting and visualization features
Analytics+ is the other half of the story, and it carries the highest ratings. The recurring theme is breadth: one visual that replaces several. AppSource reviewers describe it as a 3-in-1 tool for charts, tables, and KPI cards, with simple navigation across more than 100 chart types (AppSource reviews, Dec 2024). G2 reviewers single out the visualization specifically:
"Best about this software is analytics platform with robust data visualization." Vishakha T., G2, Jun 2024
For dashboards and data stories, that range is the selling point. You get waterfalls, bullets, marimekko, Gantt, KPI cards, and small multiples without bolting on 5 separate visuals. The counterweight comes from reviewers who've used dedicated data visualization tools:
"The customization options for individual charts and layouts were somewhat limited compared to tools like Tableau and Qlik." Sarhan S., G2, Jan 2024
That's the right way to frame it. Inforiver gives you enormous breadth and strong defaults, but if your work is bespoke, pixel-level chart design, a specialist tool still has an edge on the last 10 percent.
On KPI cards, there's one reliability issue worth knowing. A Power BI user described a repeatable bug while editing a card-heavy page:
"I have one page with 10 cards on it, when I go into one card to edit it and exit, another 2-3 cards randomly go blank. I then have to go into the blank cards and switch them to table then back to card to get my numbers back." u/uselessprofession, r/PowerBI
Inforiver's team replied asking for details to investigate. If you build pages with many cards, test that exact workflow during the free trial before you subscribe.
Inforiver data entry, writeback, and planning
This is the capability that separates Inforiver from most visual add-ins, and it's the main feature of the XP&A bundle. The Writeback Matrix turns a Power BI report into a place where people enter and save data, with writeback to a long list of cloud and on-premise destinations and genuine governance around who can edit what.
"The one integrates real-time data write-back to directly write data back to financial plans and operation forecasts from reports and dashboards... This saves me ample amount of time and effort as I do not need to type the same data into different applications again." Chemkhi S., G2 (Writeback Matrix), Oct 2024
The same reviewer flagged the obvious limit, worth knowing if your team presents at client sites or conferences with unreliable Wi-Fi: go offline and the platform goes dark entirely.
"If used while offline, the platform is unavailable and one cannot update their plans or communicate with their co-workers." Chemkhi S., G2 (Writeback Matrix), Oct 2024
It's a thin sample (the Writeback Matrix has few public reviews), so treat the sentiment as directional rather than settled. But the feature set is real and well documented, and for budgeting, forecasting, and what-if planning inside Power BI, very few competitors offer this without a separate planning platform.
Ease of use and the no-code promise
Across every source, the most consistent praise is that you don't need DAX. This is the theme that shows up on G2, AppSource, and Reddit alike. On AppSource, reviewers say people from an Excel background pick it up quickly when moving reports and dashboard work into Power BI.
One made the comparison directly: building the same sophisticated matrices by hand in DAX could take weeks, where Inforiver gets you there in a few hours with an easy learning curve (AppSource reviews, Aug 2022).
When several unsponsored AppSource reviews say the same thing, it's a strong signal. The shared experience is a real drop in the skill barrier: people who know Excel can build formatted reports and calculations without learning advanced DAX, which is what "no-code" actually has to mean to be worth anything.
Nevertheless, there's a cost to all this power. The same feature density that makes Inforiver powerful means there's a lot to learn. The Reporting Matrix review with the most helpful votes on AppSource came from a buyer who ran into trouble with license implementation, got no reply after contacting support more than once, and couldn't find training materials (AppSource reviews, Dec 2022).
So "no-code" lowers the floor for building reports, but the ceiling is high enough that you'll still need to budget real time for the documentation and onboarding.
Performance and scale: Inforiver's disadvantages
If there's one place to slow down before buying, it's here. The most substantive independent critique on Reddit is blunt:
"Performance is big concern with Inforiver, atleast with data that we had. We wanted ability to sort each column individually in matrix which default matrix does not support so were looking for alternates." u/dilkushpatel, r/PowerBI
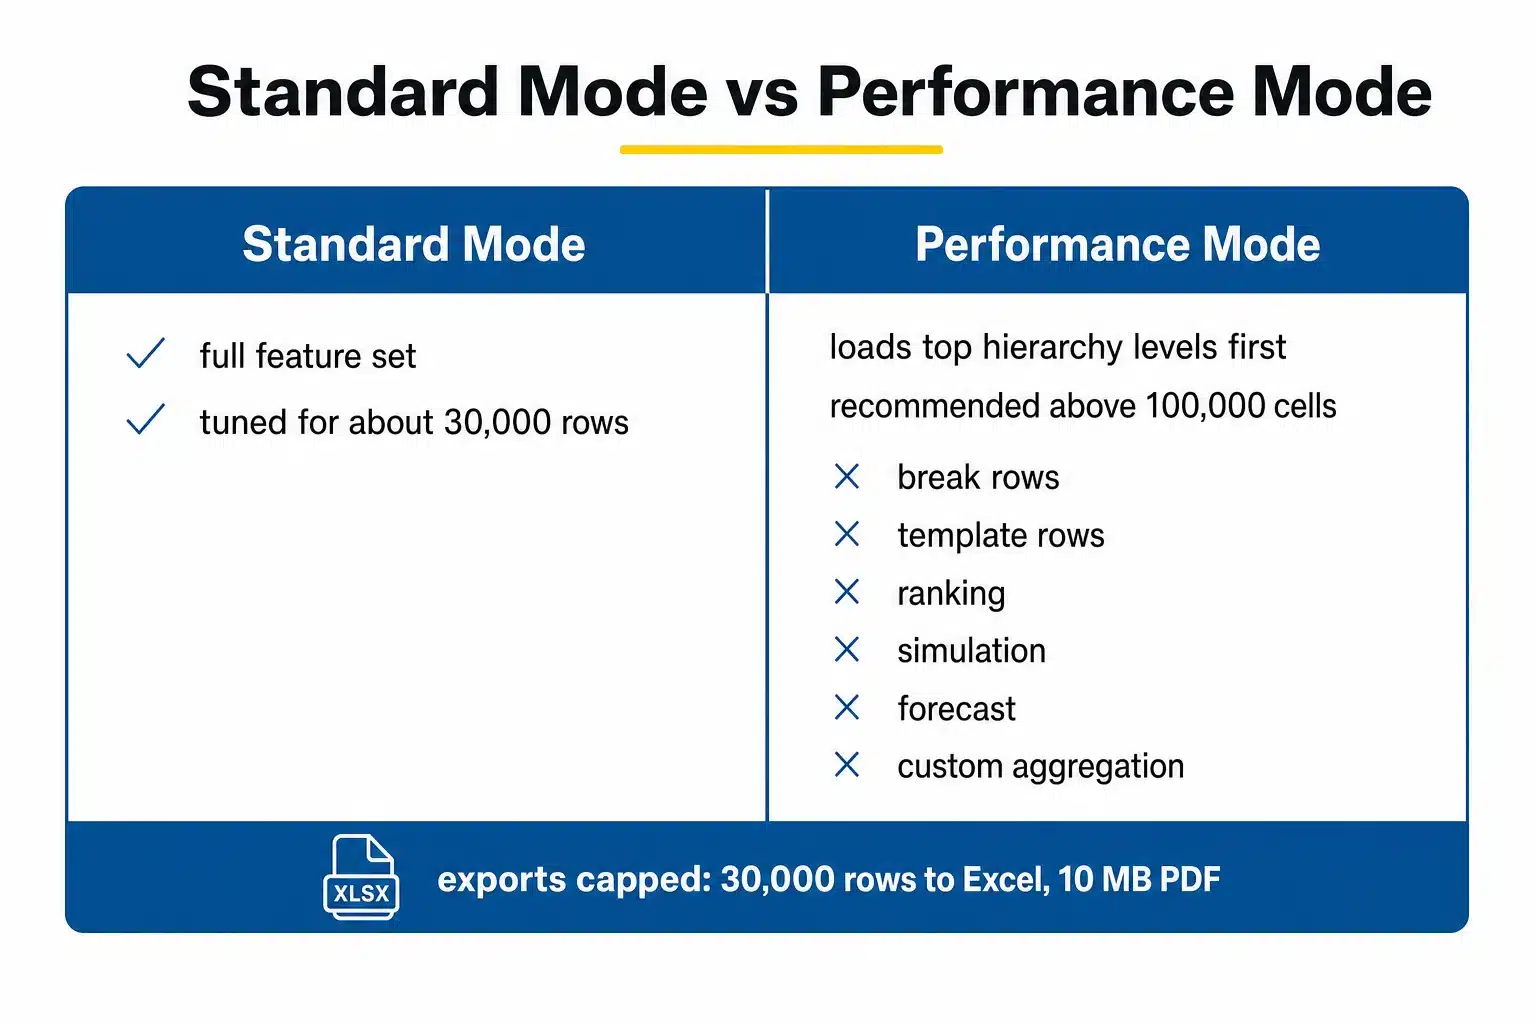
G2 echoes it in smaller notes: "Sometimes it lacks in the overall performance" (Upendra Y., Sep 2024) and "Slow loading times" (Mr S., Jan 2024). Inforiver has a real answer, a Performance Mode that loads only the first hierarchy levels and drills on demand, which the vendor recommends for reports over 100,000 cells.
But the trade-off is obvious and comes straight from Inforiver's documentation: in Performance Mode, several features become unavailable, including break rows, template rows, ranking, simulation, forecast, and custom aggregation.
The docs also state the tool is optimized for around 30,000 rows and is not recommended for large-volume, extract-type reports, and that exports are capped at 30,000 rows for Excel and 10 MB for PDF (source: docs.inforiver.com, verified June 2026).
Inforiver is built for summarized, formatted, presentation-grade reporting, and it's explicit about that. If your use case is a giant, granular table, this is the wrong tool, and the vendor more or less says so.
Export, scheduling, and sharing
Formatted export is one of Inforiver's headline strengths and a real reason teams buy it. From the Power BI community:
"Once you put it, lot of impossible things become possible. Print to PDF, Export to excel with formatting, easier (excel like) calculations and more users will start using the tool." u/premece, r/PowerBI
That captures the upside well. Native Power BI export to Excel loses your formatting; Inforiver keeps it, and it can schedule reports out as Excel or PDF on a cadence. The recurring caveat is speed:
"Exporting data from Inforiver might take a lot of time than other analytics tools." Prabin S., G2, Jan 2024
Slow export comes up from 2 independent G2 reviewers (Prabin S. and Satyendra S.), so it's a pattern, not a one-off, and it lines up with the export caps above. The formatting fidelity is worth a lot; just don't expect instant exports on heavy reports.
Security, governance, and support
For a custom visual, the security story is better than you might expect, and it rests on one fact: both the Reporting Matrix and Analytics+ are Microsoft-certified visuals.
Certified visuals don't call external services, so your data stays inside the visual and your Power BI report rather than being sent anywhere (source: inforiver.com, verified June 2026). On the planning side, the Writeback Matrix adds admin and user-level controls, with column and row-level permissions over who can write back. We did not find a public SOC 2 or ISO 27001 attestation for Inforiver in this research, so if formal compliance certification is a hard requirement, ask the vendor directly rather than assuming it.
Support sentiment is mostly warm. On G2, reviewers mention "Great customer support whenever get stuck" (Carlos N.), and on AppSource the Writeback Matrix reviewer credited a support team that answers questions in good time. It isn't unanimous: one G2 user said replies took "longer than expectations," and the 2022 AppSource buyer above couldn't get license help. The vendor is also visibly active in the Power BI community, answering questions under its own account, which counts for something.
The scorecard
Scores are out of 5, weighted for a blended Power BI audience and tied to the evidence above. A note on the decimals: they are editorial judgments anchored to the sourced evidence, not measurements. Read a 4.7 as "strong, with the caveats noted", not as arithmetic; the "Why" column is the part that matters.
| Criterion | Weight | Score | Why |
|---|---|---|---|
| Reporting and formatting depth | High | 4.7 | SSRS and Excel-grade control; top-rated matrix visual on AppSource; IBCS certified |
| Charting and visualization | High | 4.5 | 100+ charts, cards, Gantt in one; minor per-chart customization limits |
| Data entry, writeback, planning | Med-High | 4.4 | Broad writeback with real governance; thin public review sample; no offline |
| Ease of use (no-code, no DAX) | High | 4.5 | Repeated, unincentivized praise; learning curve from feature density |
| Performance and scale | High | 3.3 | Tuned for ~30k rows; Performance Mode disables features; sourced complaints |
| Export and sharing | Med-High | 4.0 | Formatted Excel and PDF export is a standout; export is slow and capped |
| Pricing and total cost | High | 3.3 | Most common complaint in reviews; per-product licensing; every viewer takes a named seat. Some sentiment predates the February 2024 licensing overhaul |
| Security, governance, support | Med | 4.2 | Certified visual keeps data in-tenant; warm but not perfect support |
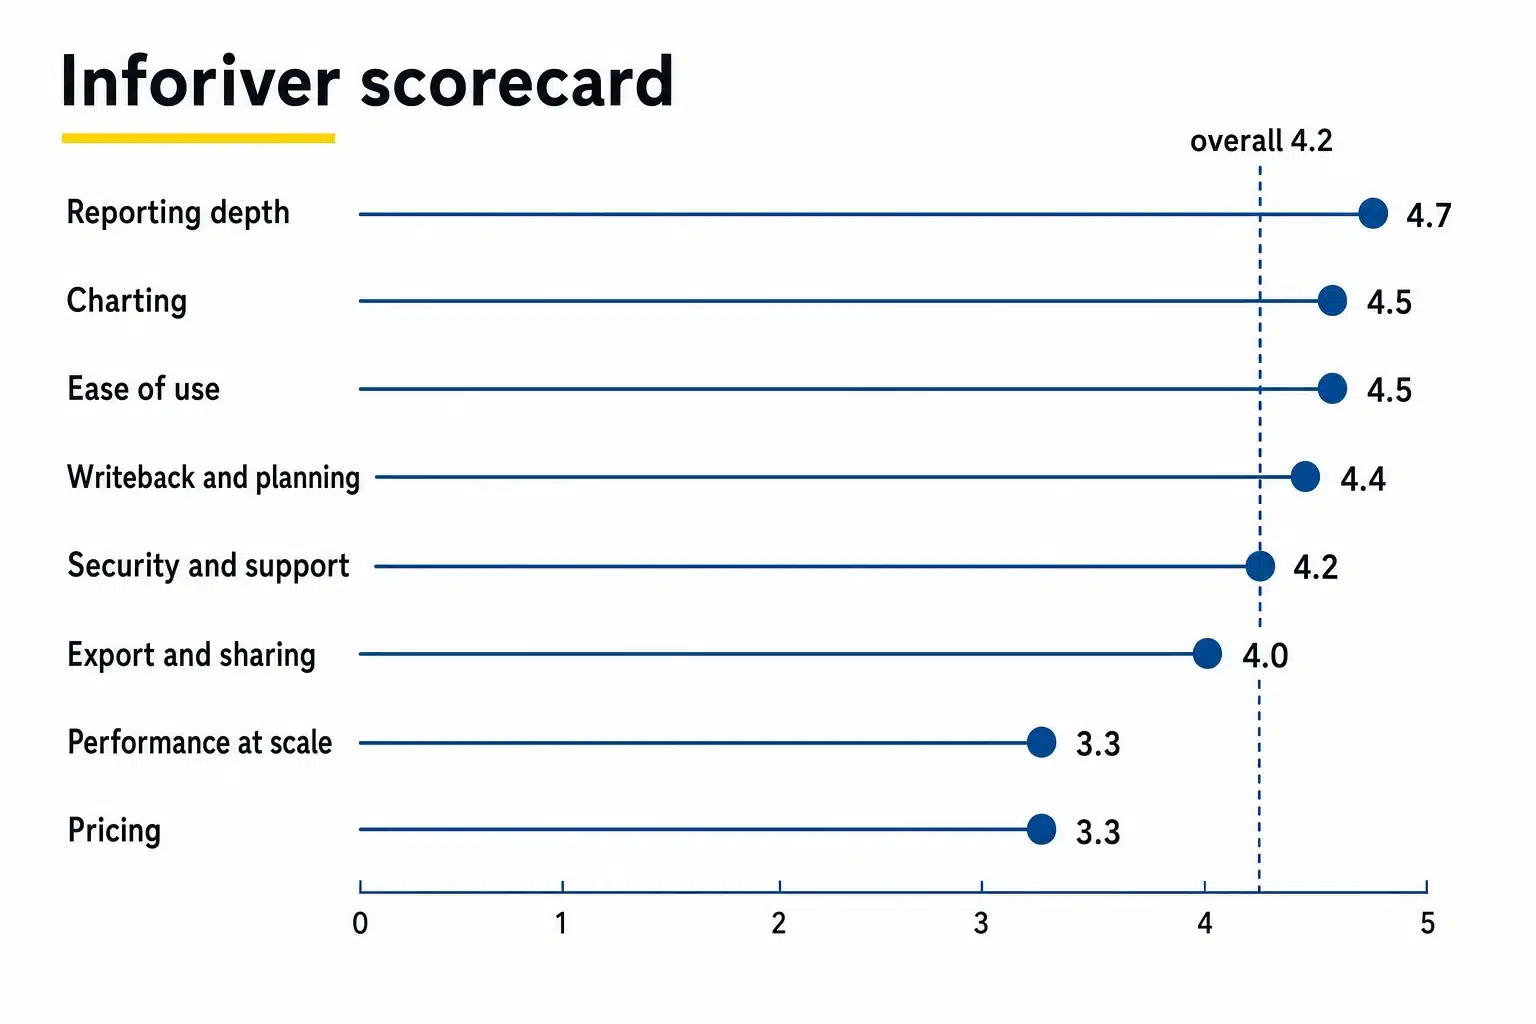
Overall: 4.2 / 5.
That sits just below Inforiver's incentivized G2 average, which fits the evidence: the product is genuinely strong where it's strong, and the price and large-data caveats are real.
One score to watch: pricing. The review sentiment behind the 3.3 spans several licensing eras: developer-based pricing rose sharply in November 2023, was retired in February 2024, and the current per-user tiers have held since. Complaints made under the older, steeper models may age out under the current rates, where the real cost drivers are viewer seats at scale and stacking multiple products. The score stands on the evidence that exists; we'll revisit it as reviews from the current pricing era accumulate.
Final verdict
Inforiver is one of the most capable no-code reporting and analytics suites in the Power BI ecosystem, and the user evidence is consistent enough to trust. If you do financial or management reporting and you've been fighting the native matrix, it will likely feel like a different class of tool, especially for formatted P&Ls, variance reports, paginated output, and Excel-fidelity exports. The writeback and planning capability is a real differentiator that few visual add-ins match.
Buy it if formatted, presentation-grade reporting and no-code calculation are your priorities, and you can clear the budget and the custom-visual approval. Think twice if your reports run over huge, granular datasets, or if per-user seat pricing is hard to justify across a wide viewer audience.
Frequently Asked Questions
Is Inforiver free?
The Super Filter slicer is free on AppSource, and there's a free trial of the paid visuals. The Reporting Matrix and Analytics+ are paid per-user subscriptions: $5 to $2.40 per user per month for the Reporting Matrix depending on team size, and $3 to $2.40 for Analytics+, with every creator and viewer taking a named seat. Domain-wide licensing starts at $12,000 per year, quoted by company size (source: inforiver.com pricing pages, captured live 29 July 2026). The per-user model replaced Inforiver's developer-based licensing in February 2024; older articles and reviews quoting per-developer prices predate that change.
Does Inforiver need DAX?
No. Its main selling point is Excel-like calculations and report building without DAX, which is the most praised aspect across reviews (G2 and AppSource reviews, 2022 to 2024). Advanced builders can still go deep, but the floor is much lower.
Is Inforiver safe with company data?
The Reporting Matrix and Analytics+ are Microsoft-certified visuals, meaning data stays inside your Power BI report and isn't sent to external services (source: inforiver.com, verified June 2026). For formal certifications like SOC 2, confirm directly with the vendor.
How big a dataset can Inforiver handle?
It's tuned for summarized, formatted reports of roughly 30,000 rows. Larger or deeper hierarchies need Performance Mode, which disables some features. It isn't built for very large extract-style tables (source: docs.inforiver.com, verified June 2026).
Who makes Inforiver?
Inforiver is made by Lumel, which describes itself as the top Power BI AppSource partner and is based in Plano, Texas (source: inforiver.com, verified June 2026).
Where Zebra BI fits as an alternative to Inforiver
If you're weighing an Inforiver alternative, Zebra BI is the tool most often shortlisted alongside it for finance reporting. Its focus is deliberately narrower: standardized, IBCS-native business reporting, with visuals re-certified to the standard in December 2024.
Where Inforiver gives you a vast, Excel-like canvas, Zebra BI gives you clean variance reports out of the box: its visuals calculate absolute and relative variances automatically, so actual-versus-budget-versus-forecast comparisons need no hand-built logic (source: zebrabi.com product pages, verified June 2026). That favors teams valuing consistency and speed over maximal configurability.
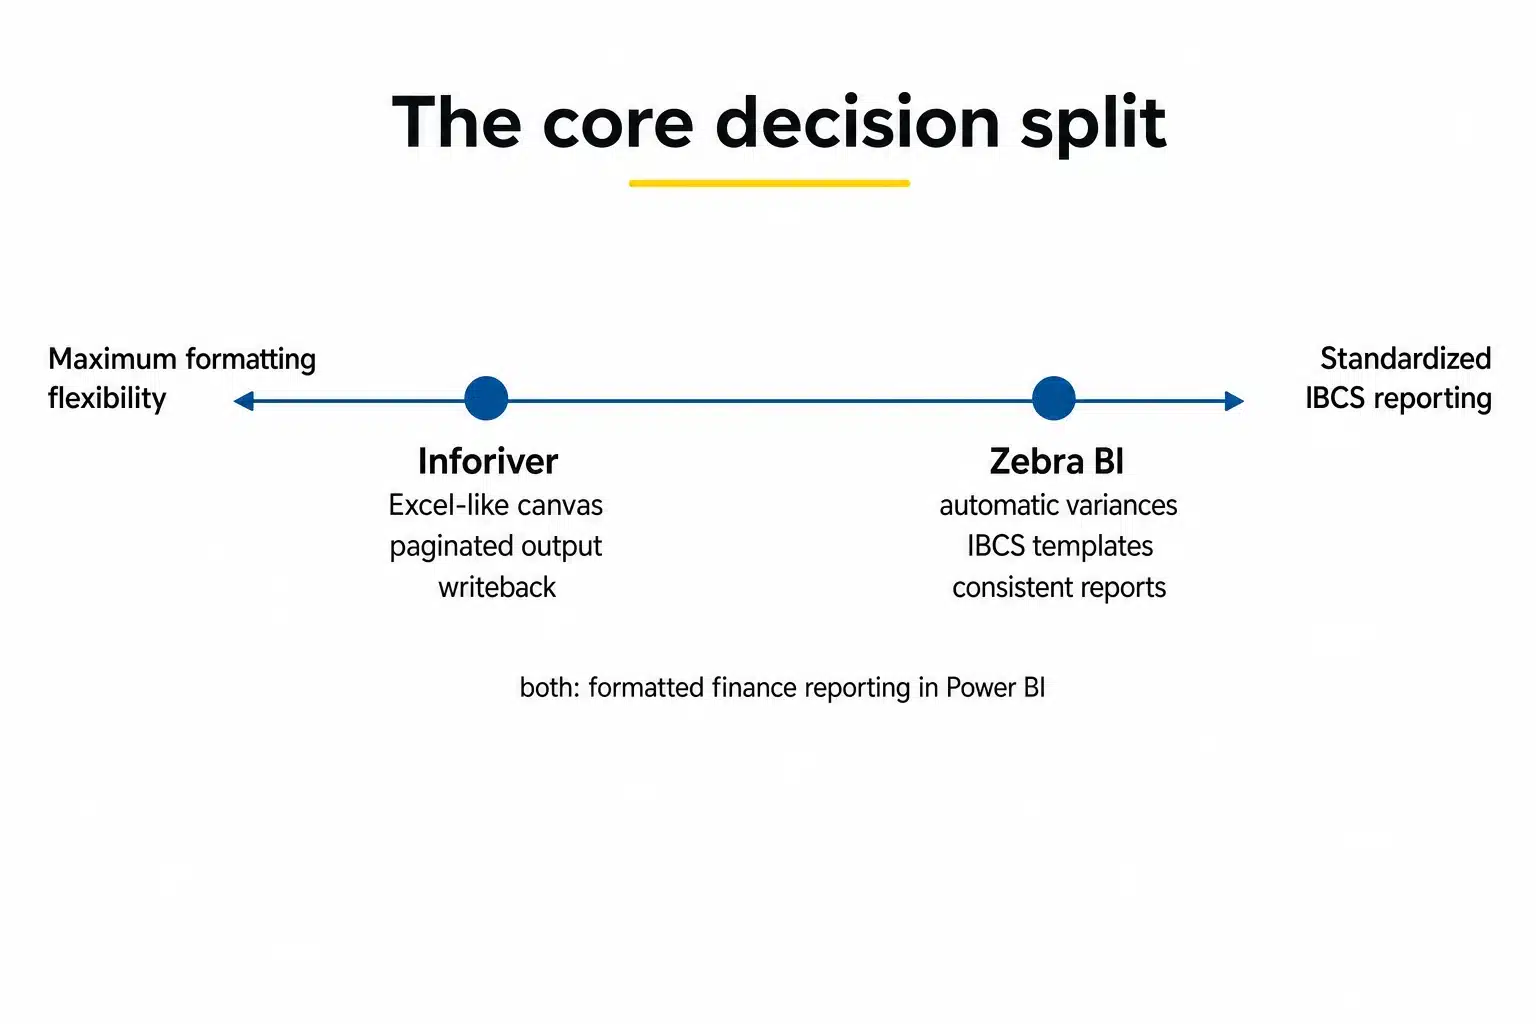
The split is clean: Inforiver for maximum formatting flexibility and writeback in one platform; Zebra BI for fast, standardized, variance-first reporting. Try Zebra BI on a report you actually care about; one afternoon will tell you whether it fits.
Sources: Inforiver and Lumel official pages (inforiver.com, docs.inforiver.com), verified June 2026 with pricing pages re-captured live 29 July 2026 and checked against Internet Archive copies back to February 2025; Inforiver's own pricing-change announcements (blog, November 2023); Microsoft AppSource listings for Inforiver Analytics+, Reporting Matrix, and Writeback Matrix; G2 reviews for Inforiver Analytics+ and Writeback Matrix; Power BI community forum and r/PowerBI discussion; KnowledgeBank by obviEnce (YouTube); IBCS and Zebra BI official pages. Pricing and ratings are point-in-time and may change.
Corrections and disclaimer
This review draws on public information, official product documentation, and aggregated user reviews, accurate to the best of our knowledge as of June 2026, with pricing re-captured from the live pricing pages on 29 July 2026. Pricing, ratings, features, and availability change over time. If you spot anything here that is inaccurate, out of date, or inconsistent, please tell us at aarti.bhanushali@zebrabi.com and we will review it and update the article.
Inforiver and Lumel, along with Microsoft, Power BI, and Microsoft AppSource, are trademarks of their respective owners. This article is independent commentary, intended for information and comparison only, and is not affiliated with, authorized by, or endorsed by Inforiver, Lumel, or Microsoft. Microsoft AppSource ratings are cited as published facts with links to the source listings, and AppSource review text is summarized rather than reproduced.
