Tag: Data Visualization

March 25, 2024
Data Storytelling with Power BI Comments: Shaping Insights and Decisions in 2024
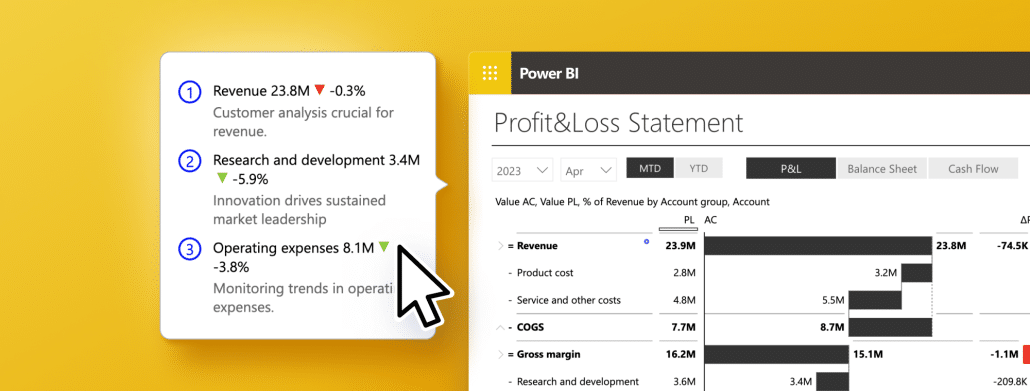
Find out why you should include comments in Power BI reports to deliver clear context and insights, which will help you make informed and strategic decisions.
March 21, 2024
Data Visualization Trends 2024: Don't Get Left Behind – Discover What's Next
Explore 2024's data visualization trends for better business insights, integrating AI, interactive reports, and cross-platform collaboration.
March 15, 2024
How to Perform Pricing Analysis in Excel
Learn how to perform pricing analysis in Excel with our comprehensive guide.
March 14, 2024
Understanding Business Insights: The Ultimate KPI Cheat Sheet
Learn how to understand business performance metrics across industries with Zebra BI's Ultimate KPI Cheat Sheet.
August 24, 2023
The Ultimate 2023 Bar Chart Guide
Uncover the process of crafting effective bar charts. Dive deep into Excel and Zebra BI's rich capabilities for a superior data presentation.
August 15, 2023
Scenario Analysis with Zebra BI: The Essential 2023 Guide to Avoiding Costly Business Mistakes
Explore the power of scenario analysis with Zebra BI. Seamlessly transition between Power BI, Excel, and PPT for informed business decisions.
June 29, 2023
How to create a Horizontal Waterfall Chart in Power BI: Ultimate 2023 Guide
Discover how to create a Horizontal Waterfall Chart in Power BI for impactful, dynamic data visualization. Transform your reports with ease.
June 16, 2023
How to Add Filter Button in Power BI: 6 Key Steps for Better Analytics
Learn how to add filter button in Power BI. Boost your analytics with intuitive filtering. Simplify data insights with our easy-to-follow guide.
PowerPoint
May 28, 2023
What is EBITDA, how to calculate EBITDA, and how to present it
Discover what EBITDA is, learn how to calculate it, and explore ways to effectively present it for strategic financial analysis in our comprehensive guide.

Pagination