7 Tips for Creating Effective Financial PowerPoint Presentation: Best Practices and Techniques
Financial reporting is crucial for any business, as it provides valuable insights into company performance. It helps identify areas of improvement and helps make informed decisions. PowerPoint presentations have become a popular medium for communicating complex financial data in a visually appealing and easily digestible manner.
In this guide, we'll explore 10 tips for creating effective financial PowerPoint presentations that engage your audience and convey your message with clarity and precision. These best practices and techniques will help you transform your financial data into a compelling narrative. This will make it easier for stakeholders to understand and act on the information presented.
So, whether you're a seasoned finance professional or a newbie to financial reporting, these tips will help you enhance your presentations and help the office of the CFO and C-level management in your organization draw actionable insights, quicker and easier.
Try Zebra BI for Office for free!
See how easy is to create visually stunning presentations. Try out the 30+ charting options and discover what they can do for you.
1. Crafting a Clear and Concise Message
A successful financial PowerPoint presentation begins with a clear and concise message that accurately captures the company's financial state. To achieve this, consider the following steps:
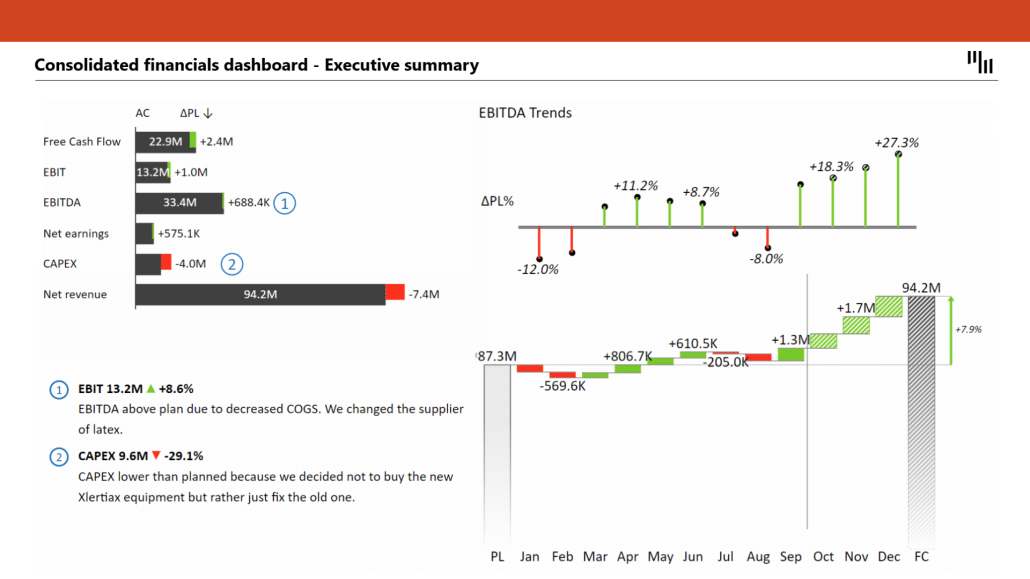
Start with a summary of the company's financial state
Before diving into the details, provide an executive summary that briefly outlines the company's overall financial health. This sets the stage for the presentation and helps your audience grasp the key takeaways right from the start.
Prioritize crucial information
Identify the most important financial data that support your main message and prioritize it in your presentation. This approach helps your audience to quickly grasp the key points and their implications on the company's performance.
2. Planning and Design
An effective financial PowerPoint presentation requires careful planning and thoughtful design choices. Keep these factors in mind when creating your presentation:
Define the purpose and audience for your financial PowerPoint presentation
Before designing your presentation, identify the main objectives and the target audience. This will help you tailor the content and visual elements to their specific needs and expectations, ensuring your presentation is relevant and engaging.
Choose the right template and theme
Select a template and theme that complement your company's branding and presentation content. A consistent and professional design enhances your presentation's visual appeal and reinforces your company's identity. Make sure the template you choose has a clean and uncluttered layout, allowing your financial data to take center stage.
Use a consistent and professional color scheme
Opt for a color scheme that aligns with your company's branding and ensures readability. Stick to a limited palette of colors, using contrasting shades for text and background to improve legibility. Consistency in color choices across all slides helps create a cohesive and polished look, making your presentation more visually appealing and easier to follow.
Importance of IBCS in Business Reporting
Incorporating the International Business Communication Standards (IBCS) into your financial PowerPoint presentations can significantly improve business reporting consistency, clarity, and effectiveness.
IBCS provides a unified set of guidelines for designing visualizations and structuring content, enabling better communication and understanding of financial data.
By adhering to IBCS principles, you can ensure that your financial presentations are easy to comprehend and compare. This will facilitate faster decision-making and enhance collaboration.
Zebra BI add-ins are all IBCS-certified, which ensures that your presentations comply with these best practices and deliver maximum impact.
To learn more about IBCS importance and how to achieve it with Zebra BI add-ins, read IBCS - Achieve Consistent Reporting Across Your Company.
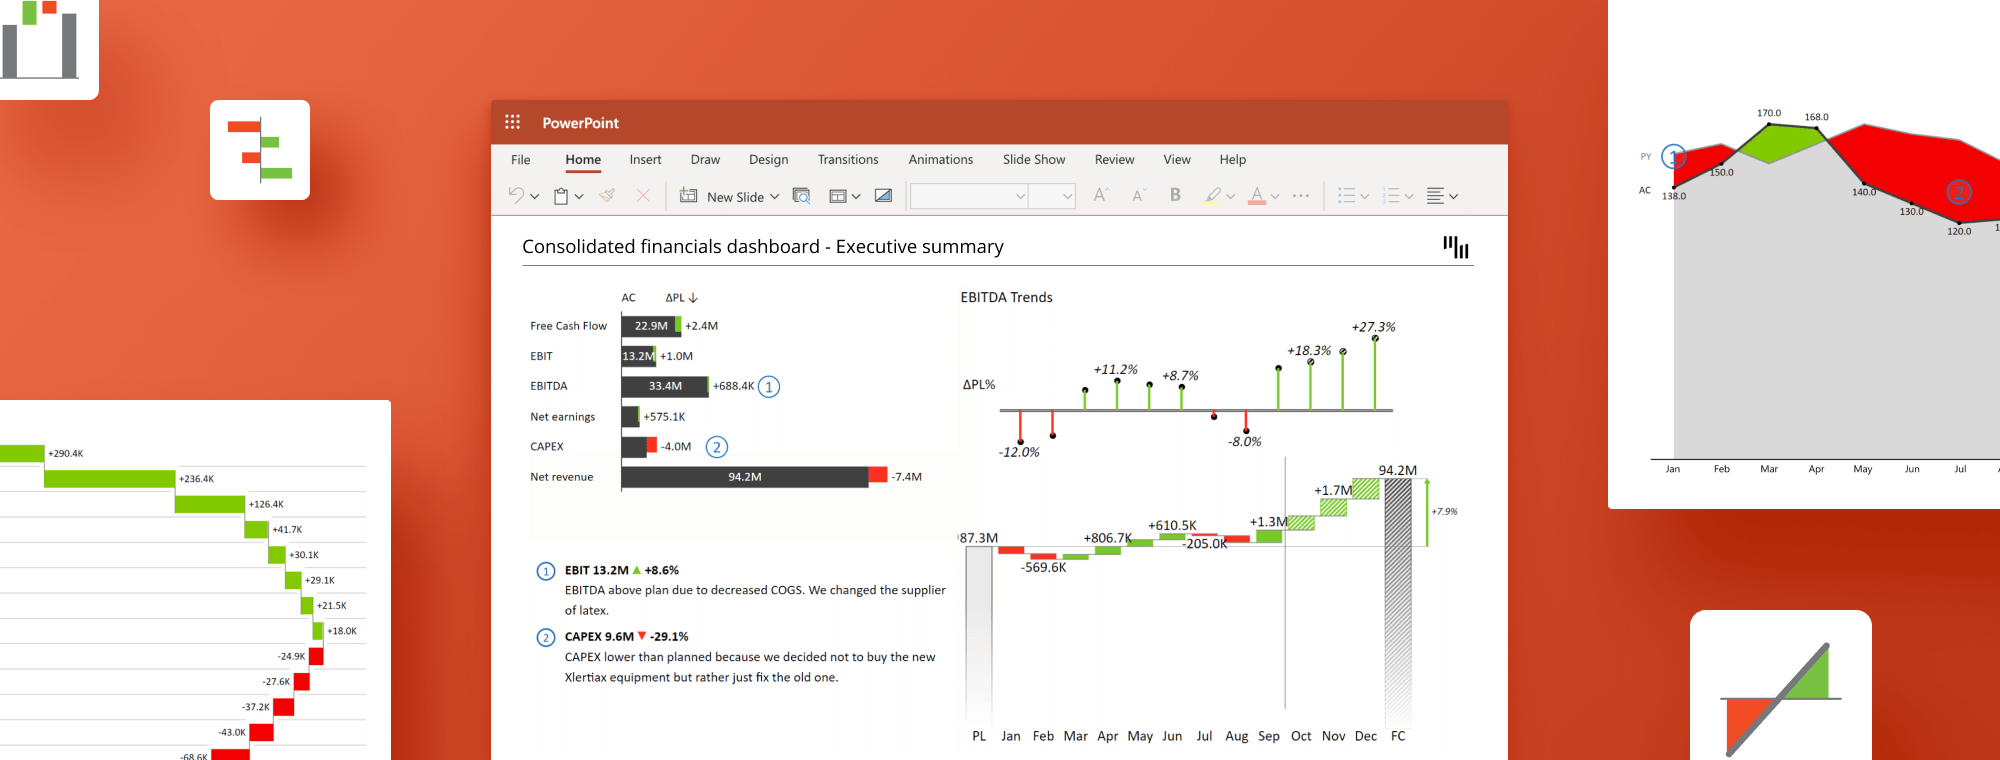
3. Utilizing Charts and Visualizations Effectively
In a financial PowerPoint presentation, charts and visualizations play a vital role in conveying complex data in a clear and engaging manner. To make the most of these visual elements, consider the following tips:
Limit to one or two visualizations per slide
Including too many visualizations on a single slide can overwhelm your audience and dilute the impact of your message. Focus on one or two visualizations per slide to effectively communicate the key points without overloading the viewer with information.
Avoid text-heavy slides and spreadsheets without context
Charts are essential in financial presentations, as they enable your audience to grasp the information quickly and easily. Minimize the use of text, financial numbers, and spreadsheets without context, and instead, rely on visual representations to convey your message. This will make your presentation more engaging and easier to comprehend.
Use the right chart types for your data
Select the most appropriate chart type to represent your financial data accurately and effectively. For example, use line charts to show trends over time, and bar charts to compare different categories. Choosing the right chart type will help your audience understand the data at a glance, allowing them to focus on the insights and implications of the information presented.
4. Ensuring Clarity and Simplicity in Financial PowerPoint Presentations
To make your financial PowerPoint presentation accessible and easy to understand, focus on maintaining clarity and simplicity throughout the presentation. Follow these guidelines to achieve this goal:
Use concise and clear language
When explaining financial data or adding context to visualizations, use clear and easy-to-understand language. Avoid jargon and technical terms that confuse your audience. Instead, opt for concise and straightforward language that allows your viewers to quickly grasp the key points.
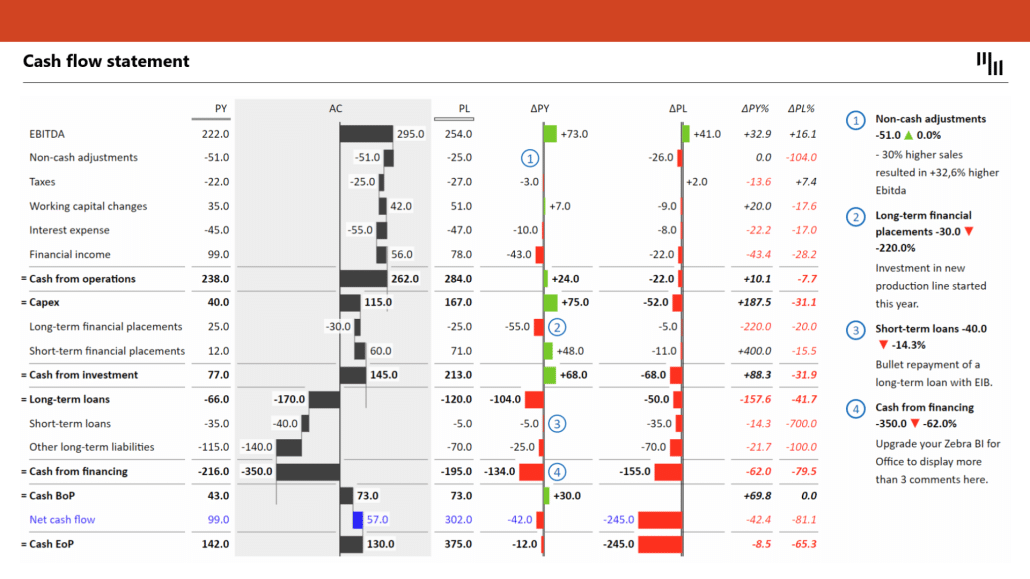
Incorporate callouts to emphasize key information
To draw attention to critical data points or trends, use callouts that highlight the most significant aspects of your financial data. These callouts can take the form of labels, arrows, or boxes and should be used sparingly to ensure effectiveness.
Follow the PowerPoint 10/20/30 rule
When creating financial PowerPoint presentations, it's essential to follow the 10/20/30 rule, which is a straightforward concept to maintain your audience's attention and deliver your message effectively.
According to the 10/20/30 rule, an effective PowerPoint presentation should:
- Be no more than 10 slides long.
- Last no longer than 20 minutes.
- Use fonts no smaller than 30-point size.
However, it's crucial to note that the 30-point font size recommendation applies primarily to presentations on large screens. If you are presenting on a smaller screen or sharing your presentation via email or other digital channels, consider using a smaller font size. This still ensures readability while accommodating more information on each slide.
By adjusting your font size based on the presentation context and adhering to the 10/20/30 rule, you can maximize the impact and effectiveness of your financial PowerPoint presentations.
5. Storytelling with Financial Data
Effective financial PowerPoint presentations extend beyond displaying data; they tell a story that helps your audience understand the context and implications of the numbers. Using Zebra BI visuals, which have built-in comments options, makes it even easier to create a compelling narrative around your financial data.
Use these tips to create a compelling narrative around your financial data:
Explain the origins and impacts of the numbers
When presenting financial data, provide context by explaining where the numbers come from and what factors influenced them. This background information can help your audience better understand the data and its relevance to the company's performance.
Zebra BI add-ins' built-in comments make it simple to add these explanations directly to your charts and tables, ensuring your audience has the necessary background information to understand the data's relevance to the company's performance.
Describe the reasons for changes in costs or other financial metrics
If your financial data reveals significant changes in costs, revenues, or other metrics, explain the underlying reasons for these changes. By offering insights into the causes and effects of these shifts, you can help your audience grasp the broader implications for the company. Using Zebra BI add-ins, you can quickly and easily add these insights to your presentation, helping your audience grasp the broader implications for the company.
Create a narrative to guide the audience through the financial PowerPoint presentation
Structure your presentation in a way that leads your audience through a logical progression of information, building a coherent narrative around your financial data. This storytelling approach not only makes your presentation more engaging but also helps your audience retain information better. To achieve this, consider using transitions, headings, and summaries to guide your viewers from one section to the next and reinforce the key takeaways at each step.
6. Enhancing Readability and Engagement
To make your financial PowerPoint presentation more effective, focus on readability and engagement. Consider these strategies to capture and maintain your audience's attention:
Break down complex concepts into digestible sections
Divide your presentation into smaller, more manageable sections that cover individual topics or concepts. This approach allows your audience to process the information more easily and maintain their focus throughout the presentation.
Use icons and images to illustrate points
Incorporate relevant icons and images to support your financial data and make your slides more visually appealing. These visual elements can help clarify complex concepts and enhance your audience's understanding of the information being presented.
Incorporate interactive elements (if applicable)
Depending on your presentation setting and audience, consider adding interactive elements such as polls, quizzes, or Q&A sessions. These interactive features can help maintain audience engagement and encourage participation, leading to a more dynamic and memorable presentation experience. However, make sure to use these elements judiciously, ensuring they complement your content and do not detract from your main message.
7. Collaborating and Sharing
Collaboration and sharing are essential aspects of creating and delivering an effective financial PowerPoint presentation. Zebra BI add-ins, which are compatible with both service and desktop versions of PowerPoint on Windows and MacOS, further facilitate these processes.
To make the most of these features, follow these guidelines:
Utilize PowerPoint's collaboration features
PowerPoint offers various collaboration tools that allow multiple team members to work on a presentation simultaneously. Using this feature, you can collect input from different stakeholders, including finance and management. This will ensure that your presentation covers all relevant perspectives and data. To collaborate effectively, use version control, track changes, and add comments to discuss ideas or provide feedback.
Gather feedback and revise as needed
After sharing your presentation, encourage your audience and team members to provide feedback on the content, design, and delivery. Use this feedback to make any necessary revisions and improve your presentation, ensuring its relevance, engagement, and effectiveness. This iterative process can help you refine your presentation skills and adapt your content to better meet your audience's needs.
Ready to supercharge your financial presentations?
Try Zebra BI for Office for free. Don't miss the chance to create engaging financial presentations that drive results for free!
Wrap up
Creating an effective financial PowerPoint presentation requires clear messaging, thoughtful design, engaging storytelling, and seamless collaboration. By following the tips and best practices outlined in this guide, you can transform complex financial data into a compelling narrative that captivates your audience. This narrative communicates your message with clarity and precision.
Remember to focus on simplicity, readability, and engagement to ensure your presentation leaves a lasting impact on your audience.
As you continue to hone your skills and incorporate feedback, you'll master the art of financial PowerPoint presentations.
The result will be improved decision-making and business results.,