 September 8th
 February 22nd
Zebra BI April Product Update
Another month brings another Zebra BI Product Update! Watch out for our new practical and educational content pieces that are here to empower you to get the most out of your reports.
Get a few tips & tricks on one of the most requested features of Zebra BI visuals, download a new Power BI template, watch the newest webinar on time intelligence, and other exciting news. Directly from the experts themselves.
Watch the April Product Update below! 👇
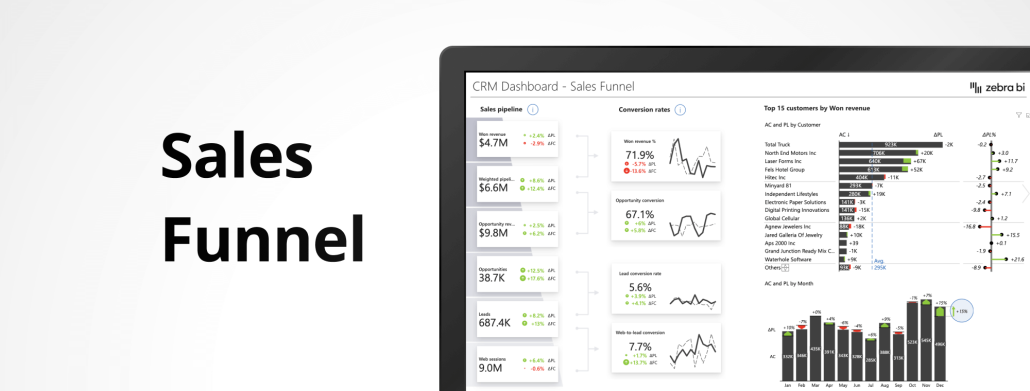
New template: Sales Funnel
In today’s business world, time is money, so having a useful template sure helps a lot in getting insights faster.
This brand new Sales Funnel Template and it's everything you need to get immediate insights into the performance of your sales team across the funnel.
It offers you a high-level overview of the most important sales KPIs along with their conversions. By clicking on each card, the report adapts to each KPI, showing Zebra BI Tables and Charts.
It has been highly anticipated among our users so make sure to check it out and make the best use of it. You're welcome. 😎
Multiple plans and forecasts for better visibility
Being flexible and agile allows you to adapt quickly in a changing business environment. It hardly ever goes the way you plan it, right?
Therefore, it is crucial to use data in a way that different outcomes are always possible, and now you can easily visualize all of them within one visual.
Explore the multiple plans and forecast functionality with Zebra BI Tables visual. It will allow you to have an overview of different scenarios to always stay on top of your game. With the ever-changing circumstances, it is indispensable to consider several plans and/or forecasts so you can act faster.
Don't miss the upcoming releases
The new release of Zebra BI Cards, Charts, and Tables is just around the corner! As usual, we are bringing some exciting new features and major improvements as we have worked closely with our customers to make sure their needs are met.
The update of Zebra BI Tables & Charts will bring an even more enhanced dynamic comment functionality, making it the most flexible and powerful commenting feature out there. Additionally, some important updates are also coming for the legend.
At the same time, the Zebra BI Cards visual will receive an important update with customization of fonts as well as the ability to use the year-to-date with your KPIs.
Stay tuned!
Are you up for a tour of Zebra BI?
Actionable Reporting has become indispensable in today’s business world. It is what distinguishes good companies from unsuccessful ones: the ability to display and understand your data clearly so you always know how the company is performing, the reasons behind it, and to plan on the upcoming activities.
The 4-Question Insight test is a simple yet very efficient way to see where your company reporting stands. To understand why Actionable Reporting is so important and how easy it is to implement it with Zebra BI, we recommend watching our on-demand product tour.

Advanced time intelligence functions in Power BI: webinar
With April’s webinar, we expanded on one of the most requested topics ever: DAX tricks and time intelligence functions. If you want to solve the most essential business questions, visualizing and showing trends over time is the crucial thing to do.
This usually opens even more questions: how to handle period calculations (MTD, YTD, Full year) or incomplete month-to-date periods with forecasts? How do you show your performance compared to a rolling or a moving average? 😬
If you missed it live you can watch the webinar on-demand and get the answers to the questions above and more. Stay tuned to the written step-by-step guide that is coming your way soon!
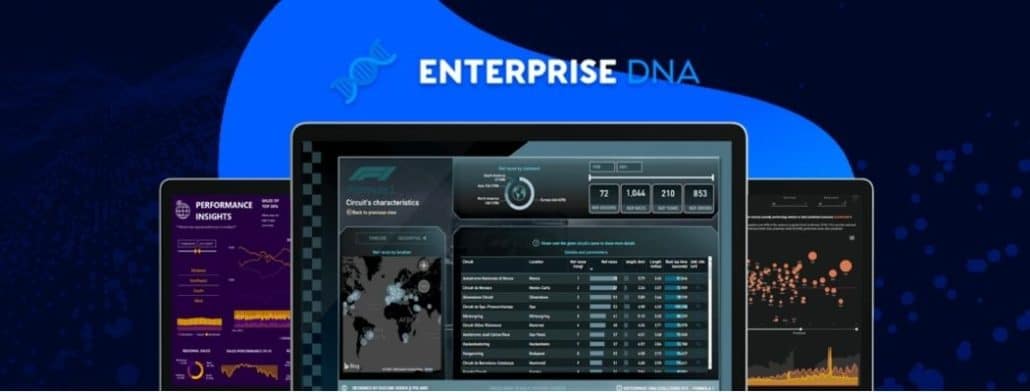
Joint session with Enterprise DNA: Zebra BI tool for choosing the right visual?
We're beyond excited to be a part of the Reporting & Data Visualization Summit 2022 hosted by our friends at Enterprise DNA! It's going to be a 3-day spectacle with 29 experts from all around the globe. If you ever struggled to choose the right chart for your data, this event is definitely worth signing up for. You'll learn all about the Zebra BI Chart Selector, an interactive tool that you can use to never doubt which chart to use for your reports.
Receive important updates directly into your inbox
Join other dataviz enthusiasts like yourself and we'll make sure you won’t miss out on any important news in the Zebra BI space - like this monthly product newsletter.
Quiero aprender de esta herramnienta
Hi Ivan, you have an option of trying the tool for 30 days for free. Just sign up here. Otherwise we have a lot of resources available together with extensive knowledge base. If you will need any additional help, get in touch with our support team. Always glad to help. Best regards.