 September 8th
 February 22nd
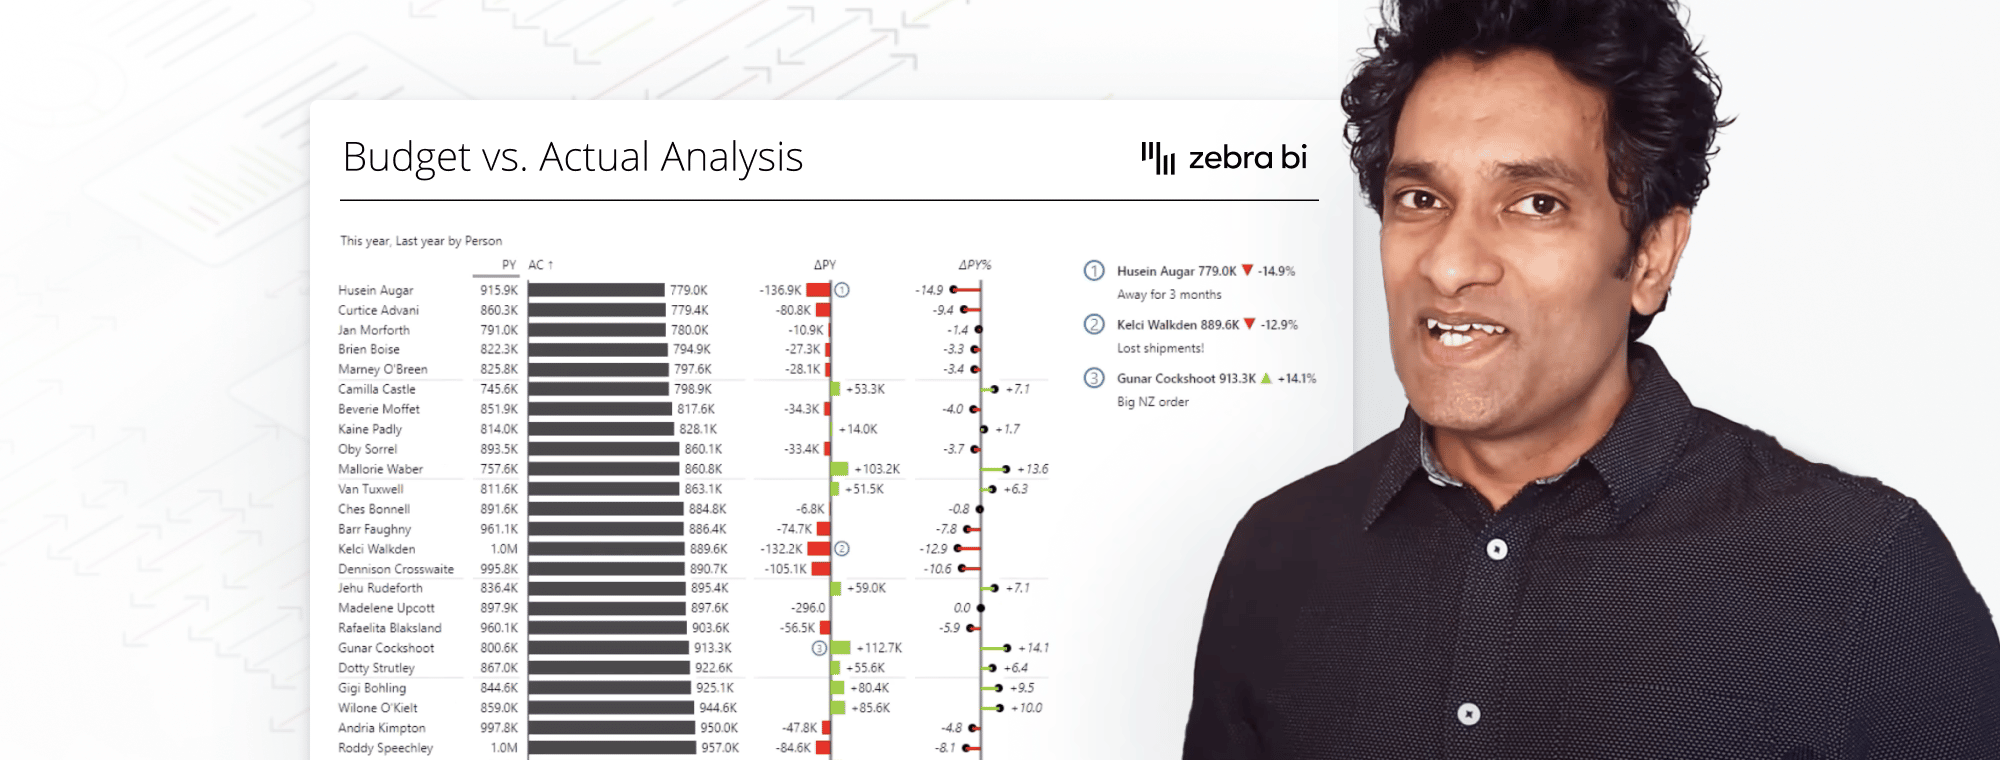
How Chandoo makes Budget vs. Actual Chart with Zebra BI for Office
Zebra BI for Office is out and it is groundbreaking!
"Zebra BI is bringing Actionable Reporting to every report in Office!"
Yes, you've got that right! Advanced visualizations in Excel & PowerPoint are no longer just wishful thinking! With Zebra BI for Office, you are now able to create professional reports, flexible dashboards, ad-hoc analyses, advanced visualizations and report prototypes easily and intuitively in Excel or PowerPoint!
A wise man (Cam Newton) once said: "Word of mouth travels faster than anything else".
Well, not only is it true, but the groundbreaking achievement of Zebra BI for Office has even reached Purna Chandra Roa, also known as Chandoo. With the help of Zebra BI for Office, Chandoo created a Budget vs. Actual chart that can impress even the most demanding managers. It only took him seconds to make and he loved it!
Zebra BI is the number one Actionable Reporting tool, and we can now use it in MS Excel as well as PowerPoint to make this kind of amazing graphs with just a click!
Chandoo
The Budget vs. Actual chart is crucial for comparing the company's planned performance with the actual one. However, creating it in a spreadsheet would usually take a lot of time, and users would need extensive knowledge on how to change the native charts to actionable visualizations.
But not with Zebra BI for Office.
The new add-in allows you to choose from many ready-to-use options with a simple click. And it doesn't end there. Zebra BI Charts & Zebra BI Tables for Office offer a complete set of advanced visualizations directly in Excel and PowerPoint. You can add dynamic comments to provide further information on the numbers and let Zebra BI automatically calculate variances for additional context.
If you want to turn your numbers into business insights within seconds, give it a try or download free templates to get inspired.
Why Chandoo likes Zebra BI for Office
Check out the video below to learn how he uses Zebra BI for Office and why he loves it.
Who is Chandoo and how can he help you "become awesome"?
Purna Chandra Roa, known also by Chandoo is Microsoft's Most Valuable Professional (MVP) and the founder of Chandoo.org. His website helps people excel at Microsoft Excel. The website was launched in 2004 with the mission to share new ideas about Microsoft Excel, while also helping other people solve their daily problems. Now his site Chandoo.org is read by millions every year. It has over 500,000 monthly views and about 200,000 regular readers from all over the world. Chandoo's YouTube channel alone has more than 327,000 subscribers.
Alongside his YouTube channel and website, Chandoo has authored over 700 articles and three books, and trained more than 20,000 individuals in different courses on Excel, Power Query, Power Pivot, and VBA. His passion for Data Analytics and Visualization can be seen through all of his works.
What is Zebra BI and how does it help to elevate your reports?
Zebra BI delivers fast and advanced solutions developed to redefine the world of reporting and data visualization. As the number one solution for Actionable Reporting, Zebra BI's state-of-the-art technologies allow you to gain a deeper insight into your business operations and efficiency so that you can further improve the way you do business.
Simply put, Zebra BI automatically calculates & visualizes your key business drivers, ushering you into the world of self-service BI. By combining highly intuitive visualization tools, you can take your reports to the next level, be they in Excel or PowerPoint.