 September 8th
 February 22nd
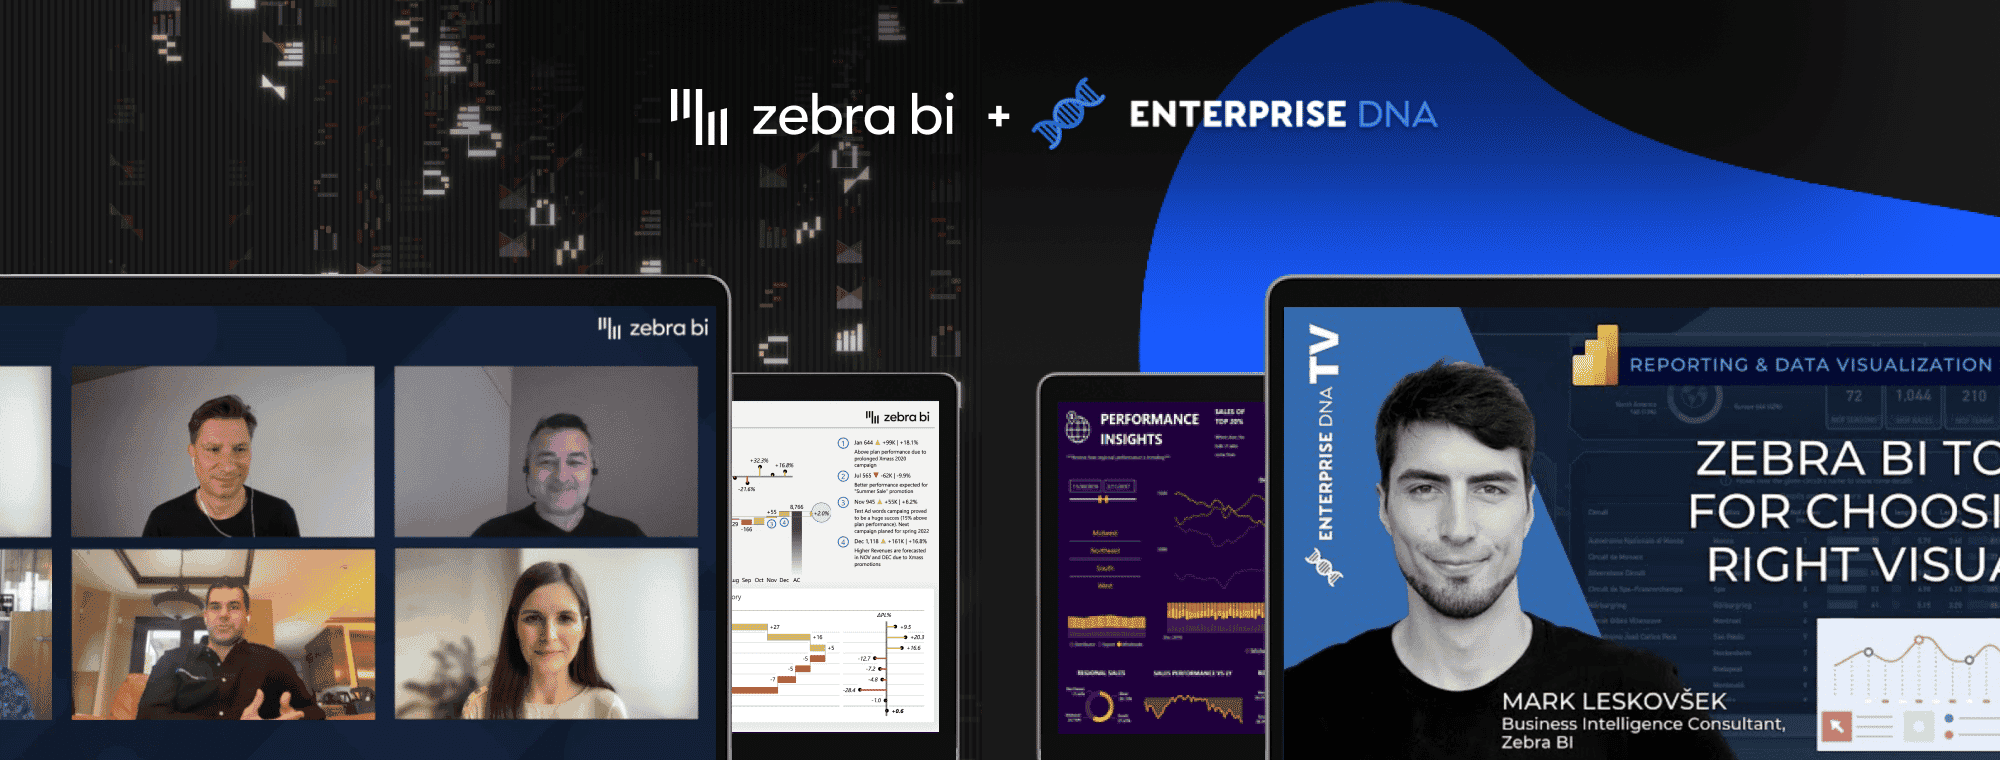
Joining forces at two major virtual events with Enterprise DNA
We are glad that the partnership with Enterprise DNA, the leading educational platform for Power BI in the world, is reaching such great results. After all, we're on a joint mission to share knowledge and empower people to create better reports.
Recently, we've joined forces for two main events that together reached about ten thousand of dataviz enthusiasts!
We've covered it all just for you: read further and you'll feel like you were there (if you weren't)! Don't miss the key learnings from a vivid debate on digital transformation at ACTION 2022 with many other experts from the field, and a whole video session on Zebra BI's interactive tool, The Chart Selector.
Sam McKay, Enterprise DNA's CEO took part in ACTION 2022
After being a part in Enterprise DNA’s event with our session at the Enterprise DNA Summit, we have taken another step to empower you to create better reports and gain knowledge together with our partners.
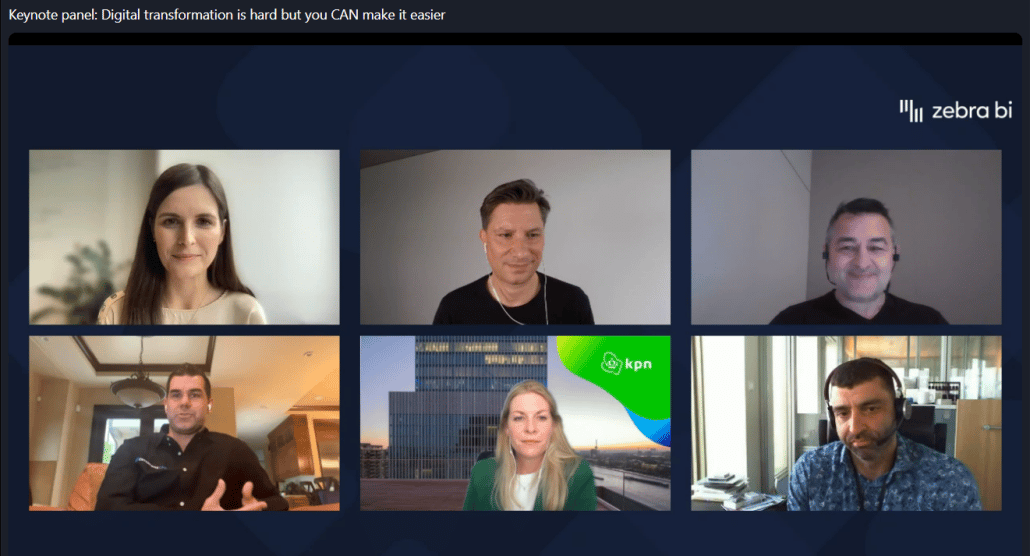
At recent ACTION 2022, the only event dedicated to Actionable Reporting, Enterprise DNA's CEO, Sam McKay, joined the keynote panel. Together with experts from PwC, KPN, Microsoft, and Zebra BI, they discussed the intriguing topic: "Digital transformation is hard but you CAN make it easier."
Key learnings from the panel on digital transformation: how to make it easier?

"At first, you should inspire." - Sam McKay, Founder & CEO at Enterprise DNA
At first, Sam McKay believes you need to inspire others: create a great Power BI report and show it to the people. For example, design something with Zebra BI, a product with a purposeful and actionable design, and find like-minded individuals and excite them about it to get the initial buy-in.
You can start small.
"Building trust is key." - Laura van den Eshof, Director Finance Insights & Analytics at KPN
There's no linear route to success, it's a journey. It's important that the new reports are done right, and it's also key to understand your stakeholders' needs and get the right requirements from the end-user. What's their job, the most important KPI? The first question shouldn't be: tell me what do you need in the report?
"By far the biggest obstacle is adoption." - Andrej Lapajne, Founder and CEO of Zebra BI
Andrej Lapajne pointed out that adoption is a complex equation with two parts: on one side, there are users, the people, and on the other part, there are tools. People are used to some tools, but nobody has really trained us how to create good reports as they don't teach this at many universities. That's why it's key to invest into training, educate, and empower people with knowledge, and it's Zebra BI's duty to do so.
At the same time, the mission of Zebra BI is also to create better tools. Andrej would like to see the transition to real self-service so the adoption is as easy and user-friendly as possible.
"We need to be oriented towards the user." - Michael Schneiders, Enterprise Architecture | Data Transformation & Strategy at PwC
Michael Schneiders from PwC adds that users don't want to interact with technology too much and that they want to see immediate results. The value is driven by users' needs so they need to be put in front of the technology. For example, security and data management are important, but the first touch people get from the reports is in the reports that they're using.
"You may have a good knife, but you have to learn how to cook." - Marc Reguera, WW PBI + Synapse Customer Engagement Lead at Microsoft
It's crucial to learn the principles of data visualization and design, and only then think about what technology you should use. What's the purpose of your report? The craftsmanship is important: the context, the right visual, the colors, etc.
You will never get a good meal out because of a good knife, it's always the cook that matters!
If you haven't seen it yet, you can watch this lively debate on-demand here: https://zebrabi.com/action2022/.
Zebra BI sharing knowledge at the Reporting & Data Visualization Summit 2022
At the end of May, Mark Leskovsek, our BI specialist took part in the Reporting & Data Visualization Summit 2022 with a session on Zebra BI's Chart selector tool to help listeners easily understand how to choose the right chart for your message.
No one should waste their time randomly inserting charts and hoping data will somehow magically present itself properly.
That is why recently, Zebra BI has developed the Zebra BI Chart Selector, an interactive tool you can use to never again have doubts about which chart type to choose for your report.
The tool became highly popular so we launched a complete live session based on it - you can watch it below! 👇
All sessions took place virtually and were covered by 29 experts from all around the globe, sharing their knowledge and expertise with everyone involved. The presenters covered every level of Power BI knowledge - a great match even for beginners!
We're glad that we've formed such a fruitful partnership and we're excited to see what else is yet to come!
Never miss a short content piece just like this again
Join other dataviz enthusiasts like yourself and we'll make sure you won’t miss out on any important news in the Zebra BI space.