Share this
 September 8th
 February 22nd
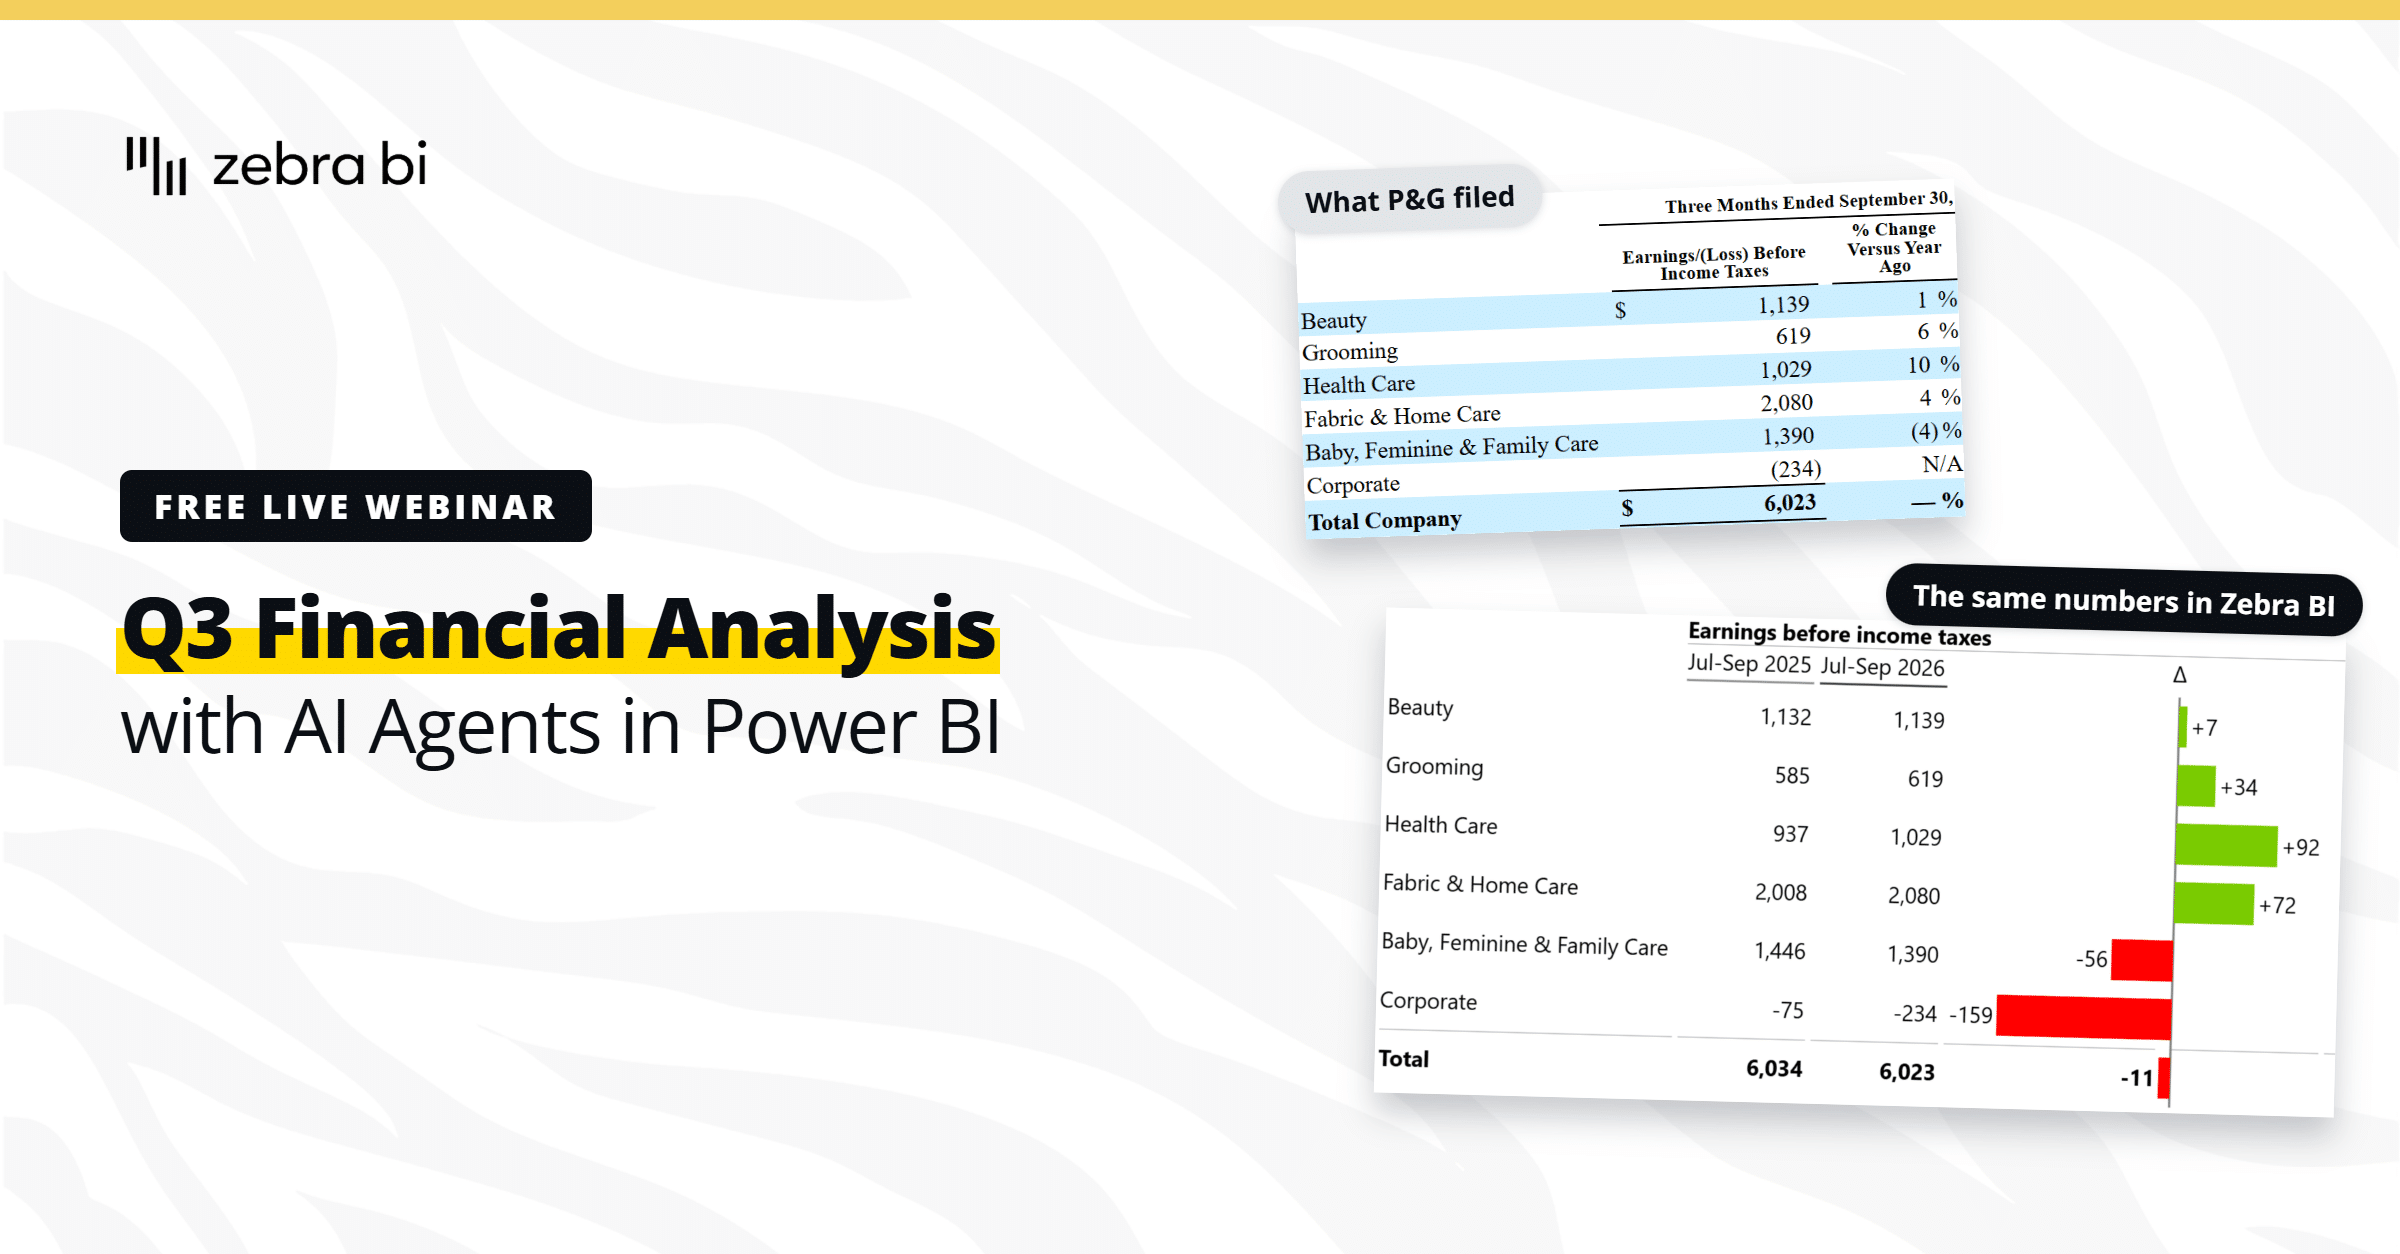
Watch the recording of our AI + Power BI + Fabric webinar: a live demo of an AI agent rebuilding an existing Power BI report, reading the data, writing its own measures, catching errors before drawing a single chart, all without touching edit mode.
AI gets a report 70-80% of the way in seconds. The last stretch, the right definitions, the right scale, the judgment on what should go out, is still where people get stuck checking instead of building. This recording shows what changes: Zebra BI agentic to create reports in Power BI with Zebra BI using Claude Code, Zebra AI turning raw data into stories you can question and tag colleagues on directly, the same Zebra BI visuals showing up inside Claude and Copilot chats via the Zebra BI MCP, plus a live Q&A on semantic models, security, and what’s coming next.
Join the early access for the AI solutions presented in the webinar.





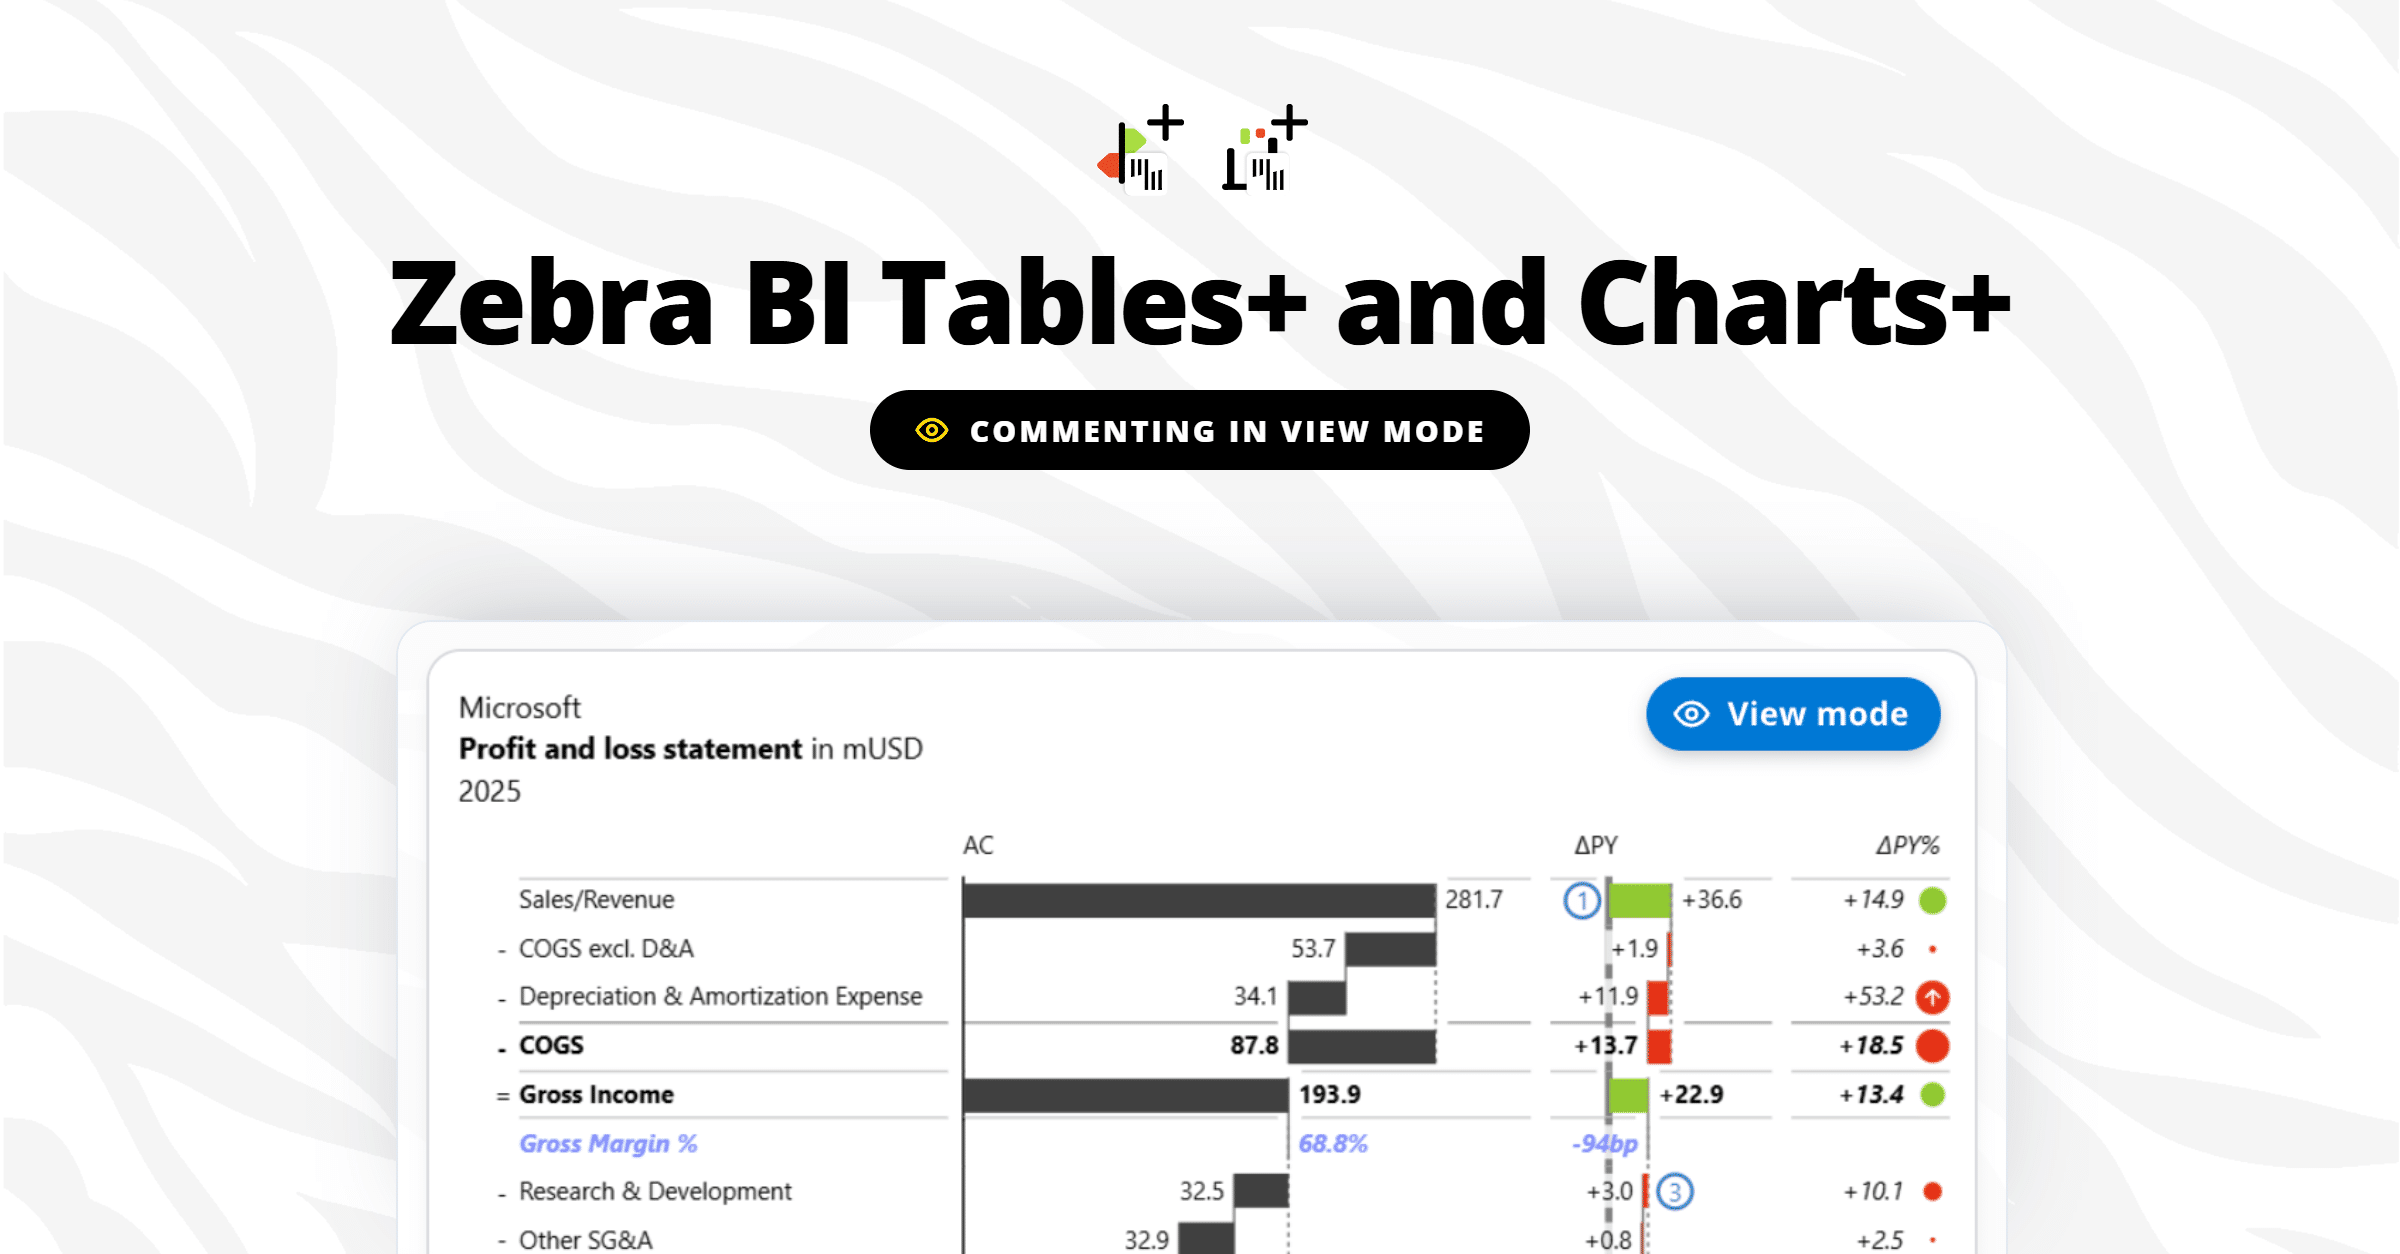
New: Zebra BI Tables+ and Charts+