 September 8th
 February 22nd
Power BI Performance Optimization: The Complete Guide to Best Practices, Techniques & Fixes
PRO Trial
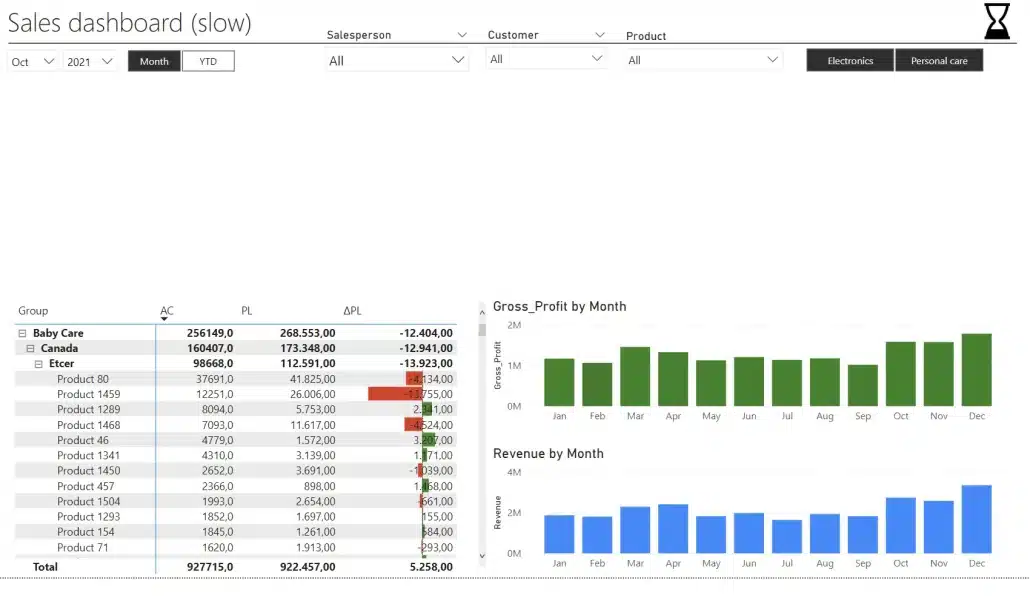
You click on your Power BI dashboard, and it freezes. 5 seconds, 10 seconds, 30 seconds pass before anything appears.
By the time it loads, you've lost the room.
This isn’t a one-time thing. Despite big investments in licenses and hours of building reports, many teams still face dashboards that don’t perform when it matters most.
Power BI dashboard performance optimization is the difference between reports people rely on and reports they keep avoiding.
And when adoption drops, data-driven decision-making collapses.
Fortunately, you can avoid that.
This guide covers the most efficient Power BI performance optimization techniques to help you turn sluggish dashboards into reliable reports.
Why Power BI Performance Optimization Matters
Fast, responsive BI dashboards don’t just feel smoother. They change how your team uses data. A report that loads in 2 seconds instead of 5 minutes shapes how people interact with insights, make decisions, and collaborate.
Business users have little patience for slow tools. When dashboards lag, people stop using them, start working around them, and eventually lose trust in that data.
74% of employees feel unhappy or overwhelmed when working with data. … Even if you have modern tools where you consolidate your data and have governed dashboards, many times, those dashboards are not actionable enough
Andrej Lapajne, Founder at Zebra BI, How Modern CFOs Leverage Power BI and AI for Better Insights Webinar
According to research, slow query performance is the most common technical problem in BI projects. Also, the longer users wait for answers, the less value organizations get from their data.
Common Power BI Performance Issues: What Causes Slow Reports?
Slow Power BI performance costs your business more than just time.
So, what’s behind Power BI performance issues? Here are 5 common reasons why your dashboards are slower than they could be:
1. Bloated or poorly structured data model
A bloated or poorly structured data model is one of the most common issues behind slow BI dashboards. Flat tables, snowflake schemas, or too many columns force Power BI to work harder than it needs to.
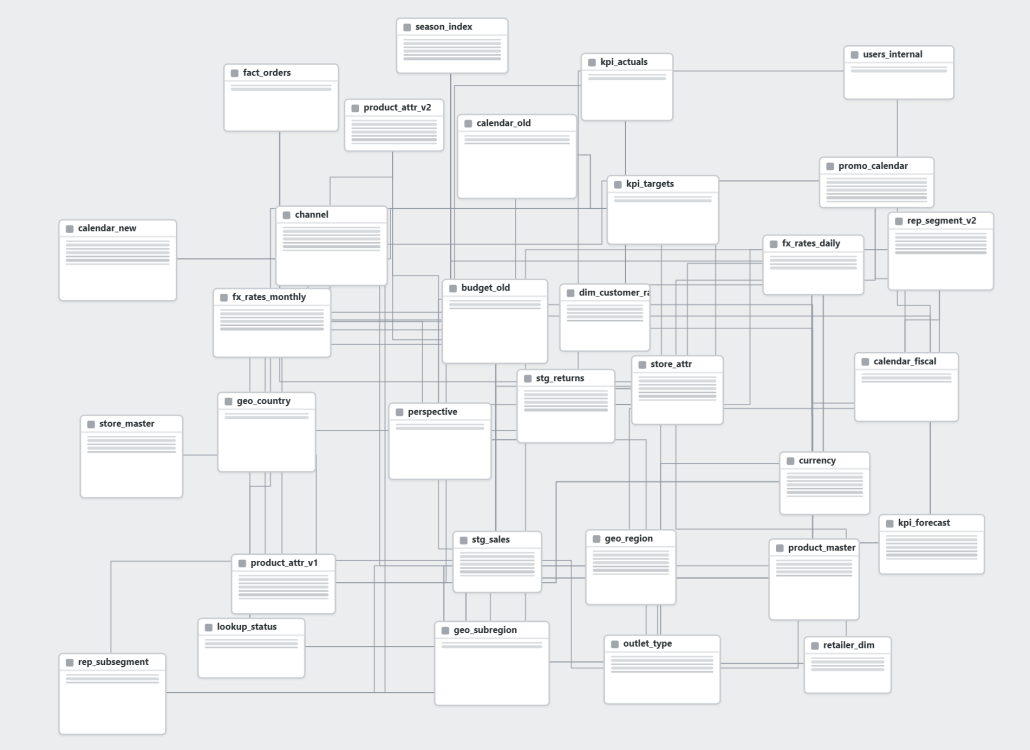
In most cases, cleaning the star schema and removing unnecessary columns is enough to improve Power BI performance.
2. Too many visuals on a single page
Every visual fires its own query every time a page loads. As a rule, each visual beyond 10 adds up to 3 seconds to your page load time.
While you might be tempted to add visuals to answer every possible question, each one comes with a performance cost for your users.
3. Excessive slicers and filters
On your dashboard, each slicer generates 2 queries: one to populate its values and one to filter the visuals. The more slicers you stack, the more queries run every time you open the page.
4. Too many data sources
Every data source you add slows down your report.
When your report pulls data from 8-9 sources, it costs you precious time. Usually, 2 or 3 consolidated sources are enough to keep your load times manageable.
5. Slow or broken query folding
When query folding breaks, Power BI ends up doing all the work instead of letting the data sources handle it. On large dashboards, this means pulling unprocessed data into memory and processing it row by row, making your report crawl.
How to measure Power BI performance
Sometimes, you can’t tell why your Power BI reports are slow. You go through the settings,make a few changes, and hope for the best.
Maybe your dashboard is now faster. Or you made it even slower.
When it comes to Power BI performance tuning, the most common mistake is making changes without knowing where the problem is.
Before you spend hours changing the wrong setting, use these tools to find the bottlenecks:
1. Performance analyzer
It’s a Power BI built-in tool shows you exactly how long each visual takes to load and where the time is being spent.
To access it, open the View menu and go to Performance -> Analyzer -> Start recording. Then, refresh your page.
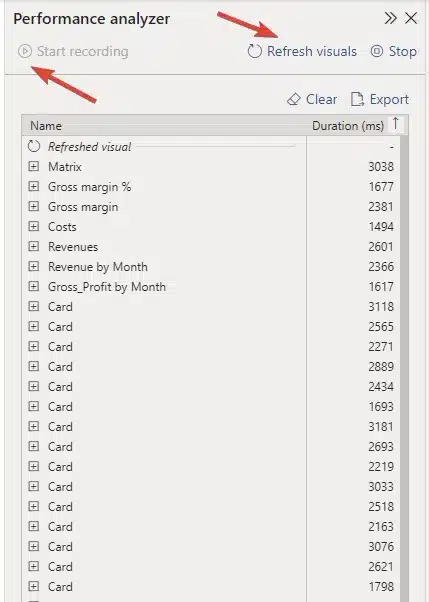
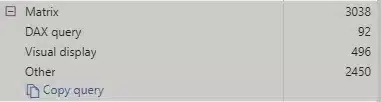
The analyzer breaks down the load time into 3 components:
- DAX query time. It measures how long it takes every query to execute
- Visual display time. Tells you how long it takes your visuals to render the data in your report.
- Other time. This includes any additional background processing.
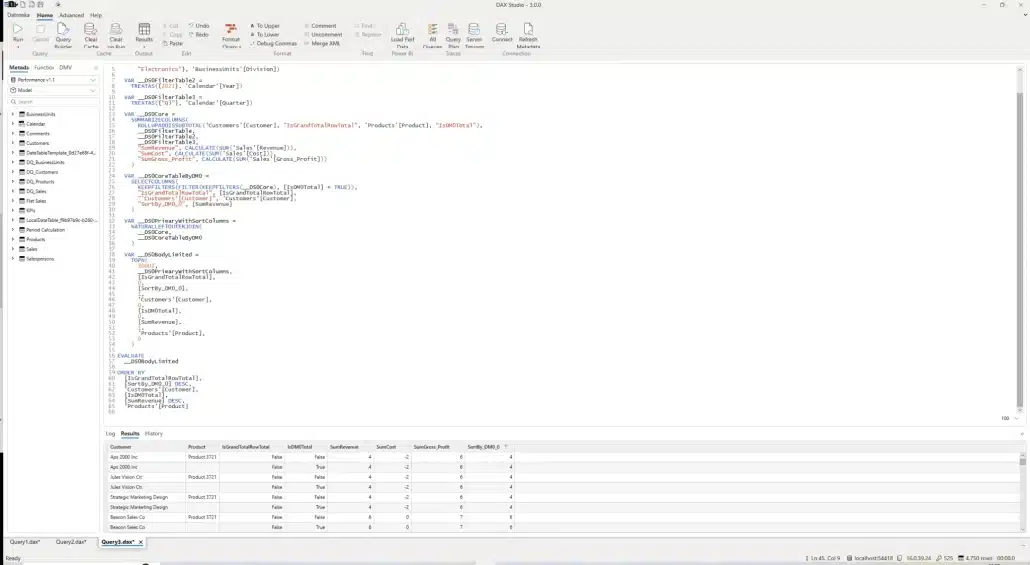
2. DAX Studio
This is a free third-party tool that connects to your Power BI model and analyzes it at query level.
It records exactly how long each query part takes to execute. Additionally, detailed query plans reveal how the engine is processing your DAX.
Unlike Performance Analyzer, DAX Studio runs and tests individual queries directly, giving you a better idea of what is slowing down your report.
3. Tabular Editor
Tabular Editor is another free third-party tool that helps you inspect and clean up your data model. It identifies unused columns, useless measures, and model bloat that would take much longer to find manually.
4. Power BI Service.
Power BI Service has 2 ways to track performance.
The first is Refresh History, which shows you how long each data set refresh has taken over time. If you notice refresh time going up, your model needs a closer look.
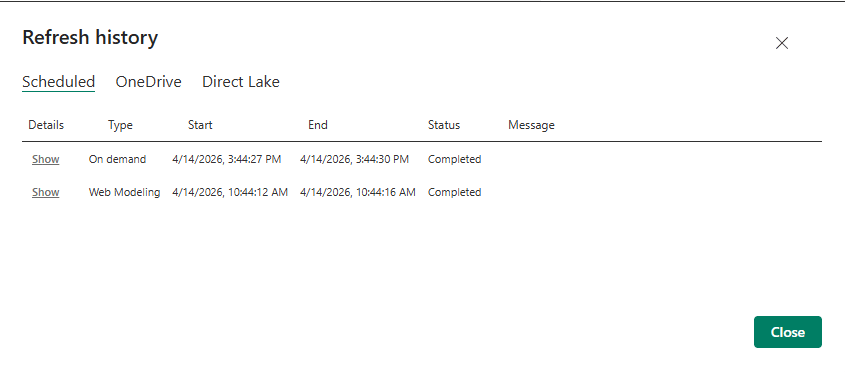
The second one is Capacity Metrics, which shows you how much memory, CPU, and query capacity your model is using.
Once your reports are live, check them constantly to stay ahead of performance issues.
Target benchmarks for Power BI performance optimization tips
For Power BI dashboards, how fast is fast enough?
In general, landing pages should load in under 2 seconds, while detail pages shouldn’t take longer than 5 seconds.
Additionally, no visual should take more than 8 seconds to render.
For dataset refreshes, set the baseline on day one and track it over time. A refresh duration that increases week after week is a sign that something in your dashboard is slowing down.
Data modeling: The foundation of Power BI performance Optimization
The truth is that the speed of your Power BI reports has very little to do with your computer, internet connection, or Power BI's servers.
The main factor in determining performance is something most users never see: the data model structure underneath your reports.
What is a data model?
A data model is simply how your data is organized and connected within Power BI.
Usually, business users focus on the visible parts: the charts, tables, and dashboards. But it’s the invisible data structure underneath that determines whether those visuals load in 3 seconds or 5 minutes.
How to structure your data in Power BI
1. Flat tables
Flat tables mix everything into a giant spreadsheet. While they are easy to understand, they force Power BI to scan millions of rows for every query.
2. Snowflake schema
Snowflake schemas break data into small, connected tables, creating a web of relationships that Power BI must navigate with every query.
3. Star schema
This is the "sweet spot" for Power BI performance. Data is organized into a central "fact" table (containing numbers like sales amounts) surrounded by "dimension" tables (containing descriptions like customer names, product categories, and dates).
This structure mirrors how people naturally think about business data and aligns perfectly with how Power BI's engine works most efficiently.
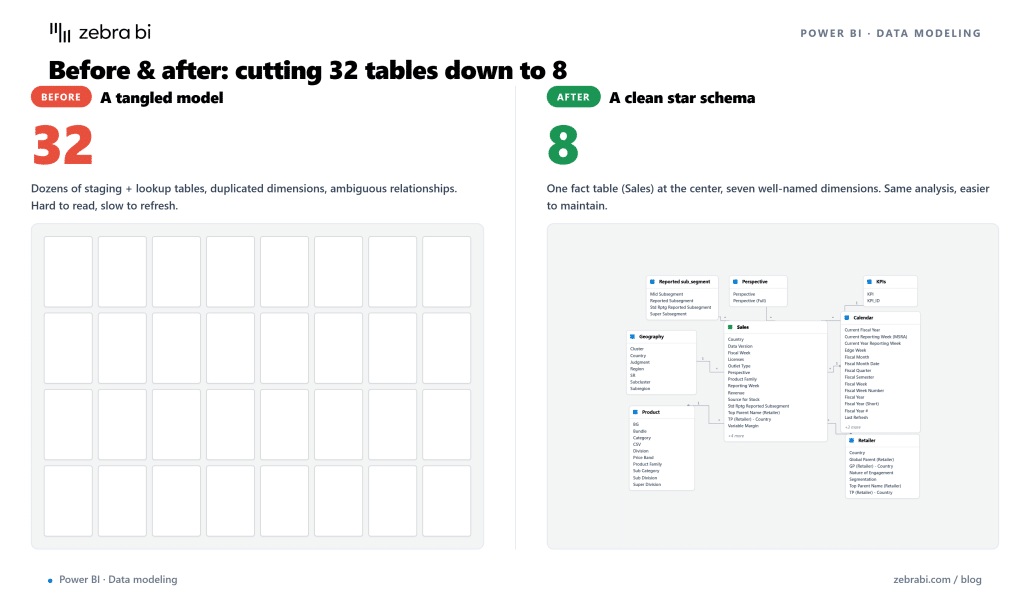
Why star schema is the best data model in Power BI
Case studies consistently show that converting complex data models to a star schema design can improve report performance by 5-10 times.
For example, simplifying a complex model with 32 interconnected tables to 8 well-structured tables results in dramatically faster performance across all reports.
Instead of jumping between dozens of tables to answer simple questions like "What were sales by region last month?", Power BI can find the answer quickly by looking at just a few, well-organized tables.
Key star schema optimization techniques
If you want faster reports built on the star schema data model, the following tips will help you achieve that:
- Reduce cardinality
Use simple numeric codes instead of long text descriptions for connecting tables. Instead of joining tables on customer names like "ABC Corporation International Ltd.", use customer ID numbers like "12345". Numbers are processed much faster than text. - Remove unused columns
Every column in your model consumes memory and processing power, even if it's never displayed in reports. Including "every possible column because somebody might need it someday" is one of the most common performance mistakes in Power BI. - Use integer keys
When connecting tables, always use whole numbers (integers) rather than text or decimal numbers. This simple change can dramatically improve how quickly Power BI processes relationships between tables. - Hide technical columns
Keep the numeric keys that make your model fast, but hide them from report builders, so they only see meaningful business descriptions.
Data Loading & Power Query Optimization
What can you do to improve performance when you're getting data in Power BI?
The most efficient way is to fix the problem before the data reaches your model.
There are 2 Power BI tools that you can choose from: Power Query and DAX. So, how do you choose the one that keeps your BI reports fast and your users happy?
Power Query vs. DAX: Which one should you choose?
Power BI has two main "engines" for working with data, and understanding when to use each one is crucial for good performance:
- Power Query: This acts like a factory assembly line, processing data once during report refreshes. It's ideal for heavy tasks such as cleaning data, merging sources, and creating calculated columns. This work happens during scheduled refreshes (often overnight), preventing slowdowns for users during the day.
- DAX: This functions like a real-time calculator, running every time a user interacts with a report. It's perfect for measures, KPIs, and calculations that need to respond to user filters. However, since DAX executes in real-time, overly complex DAX formulas can significantly slow down visuals.
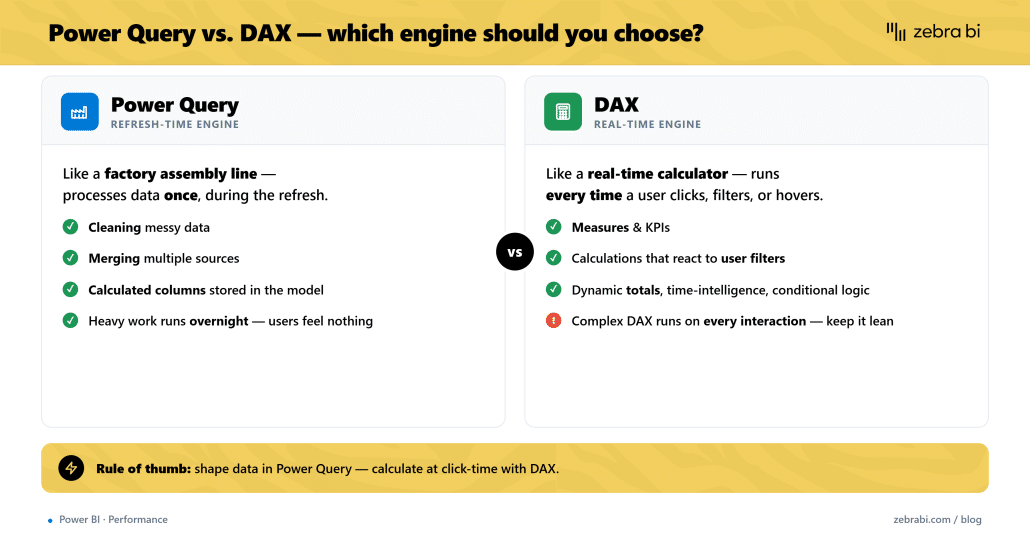
The key principle: Do the heavy computational work in Power Query during data refresh, not in DAX during user interactions.
Best settings for Power BI performance optimization
Even if you get the data model and DAX right, your BI reports can still be slow. However, you can improve Power BI performance by changing the default settings.
1. Disable Auto Date/Time Tables
Power BI automatically creates hidden calendar tables for every date column in your data. While convenient, these hidden tables consume significant memory and slow down queries.
2. Implement incremental refresh
This can reduce refresh times from hours to minutes.
For large datasets that grow over time (like transaction logs), configure Power BI to only update recent data rather than reprocess the entire data set at each refresh.
3. Optimize date handling
Use simple date formats rather than detailed timestamps. Most business reports need to show data by day, month, or year, not by the exact second a transaction occurred.
4. Enable query reduction.
By default, every slicer interaction triggers a query to your data model. Enabling query reduction adds an Apply button to your slicers, so queries work on demand, not on every click.
5. Incremental refresh: detailed setup
For large data sets, Incremental refresh is one of the most efficient settings. Instead of doing full refreshes, Power BI updates the data that changed (most recent days or weeks), leaving historical data untouched.
To set it up, you need to add 2 parameters:
- RangeStart
- RangeEnd
Step 1: Create the RangeStart and RangeEnd parameters
In Power Query, go to Manage Parameters and create 2 new parameters. Name them RangeStart and RangeEnd, with matching capitalization.
Set the type to Date/Time for both.
Step 2: Filter your date column
In your query, filter your date column so it is greater than or equal to RangeStart and less than RangeEnd. This is what tells Power BI which rows belong to which partition.
Step 3: Set up the refresh policy
Once published, set up the incremental refresh policy. You select 2 things: how many years of historical data to store, and how many days or months to refresh each run.
So, how fast is your dashboard with incremental refresh?
A dataset that takes a couple of hours to fully refresh might complete in less than 10 minutes with incremental refresh set up.
For example, you might store 5 years of sales history but only refresh the last 7 days on each run. Because only a small amount of data is processed each time, refresh times stay fast even if your data keeps growing.
Connection Mode Strategy
There are 4 connection modes, and choosing the right one is the most important setting in Power BI:
Import Mode brings data into Power BI's optimized storage engine, delivering the fastest possible query performance. Reports load almost instantly because data is stored locally in a compressed, optimized format.
Direct Query maintains live connections to your source database, ensuring reports always show the most current data. However, performance depends entirely on your source database's speed and design. Every user interaction sends queries back to the source system, which can create bottlenecks and slow performance.
Live Connection connects to specialized analytical databases like Azure Analysis Services. This can deliver excellent performance if your organization has invested in proper data warehouse infrastructure, but it limits some Power BI features.
Composite Models combine multiple approaches, allowing you to import some data for fast performance while maintaining live connections for data that must be real-time. This represents the best of both worlds for many organizations.
DAX Performance Tuning Best Practices
1. Use measures instead of calculated columns
Unlike calculated columns, measures calculate on demand and store nothing between interactions. Switching to measures wherever the calculation depends on a filter can reduce the dataset size by 30 to 50%.
2. Use VAR/RETURN to avoid repeated calculations
Every time a measure references the same expression multiple times, Power BI evaluates it. VAR evaluates an expression once, stores it temporarily, and reuses it wherever needed.
Here is how it works without VAR/RETURN:
Profit Margin =
DIVIDE( SUM(Sales[Revenue]) - SUM(Sales[Cost]), SUM(Sales[Revenue]) )
In this case, SUM(Sales[Revenue]) is calculated twice.
With VAR/RETURN:
Profit Margin =
VAR TotalRevenue = SUM(Sales[Revenue])
VAR TotalCost = SUM(Sales[Cost])
RETURN
DIVIDE(TotalRevenue - TotalCost, TotalRevenue)
TotalRevenue is calculated once and reused. This improves your Power BI dashboard performance by reducing the number of calculations Power BI runs on every query.
3. Filter columns, not tables
Different ways to filter data in DAX can get you the same results in different amounts of time.
Slower:
CALCULATE(SUM(...), table[column] = "value") vs.
Faster:
CALCULATE(SUM(...), FILTER(table, table[column] = "value"))
The result is the same with less work. A Power BI filter scans every row before applying the conditions. Column-level filtering uses internal indexing to find matching values.
4. Avoid row-by-row iteration on large tables
On large tables, functions like SUMX, FILTER, and EARLIER are sabotaging your dashboard. They loop through every row to evaluate an expression, slowing everything down.
Here’s how a slower, row-by-row iteration looks like:
Total Sales = SUMX(Sales, Sales[Quantity] * Sales[Price])
Compared to a faster, set-based aggregation:
Total Sales = SUM(Sales[Amount])
The faster version works with Power BI’s VertiPaq engines, which is designed to process entire columns.
To avoid performance issues, pre-calculate values in Power Query and aggregate with a simple measure.
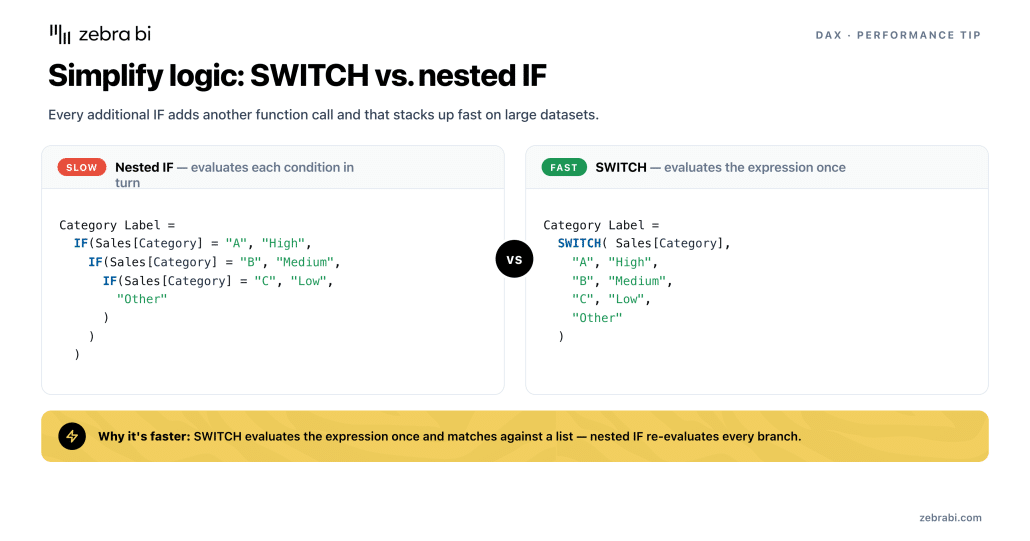
5. Simplify logic: SWITCH vs. nested IF
Every additional IF adds another function call, which stacks up quickly on large datasets.
Here’s how it looks when nested IFs slow down your dashboard:
Category Label = IF(Sales[Category] = "A", "High", IF(Sales[Category] = "B", "Medium",
IF(Sales[Category] = "C", "Low", "Other") ) )
And here’s the faster alternative:
Category Label =
SWITCH(Sales[Category],
"A", "High",
"B", "Medium",
"C", "Low",
"Other"
)
SWITCH isn’t just easier to read. It evaluates the expression once and matches a list instead of evaluating individual conditions.
Tools to diagnose DAX performance
Don’t rewrite your DAX before you know what the problem is. You can use one of the following tools to quickly identify what’s impacting your dashboard performance:
Performance Analyzer tells you whether the bottleneck is in the DAX query or the rendering. When it points to a DAX issue, open DAX Studio for query-level detail.
The key signal to look for is heavy Formula Engine usage. If it is doing most of the work instead of the Storage Engine, your DAX logic needs simplifying.
Report & Visualization Design for Power BI Dashboard Performance
Even with a perfectly designed data model, poor visual design choices can make reports frustratingly slow.
The good news is that these issues are usually easy to spot and fix once you know what to look for.
The visual overload problem
One of the most common performance killers is simply putting too many elements on a single report page.
You should not think of Zebra BI just as a visual tool or a fancy chart — it speeds up the entire development process and makes it much, much easier and more flexible for the end users as well.
Mark Leskovšek, Solutions Director at Zebra BI, Why BI fails in the Last Mile Webinar
Every chart, table, card, and slicer creates additional work for Power BI's engine. A report page with 15-20 visual elements might look comprehensive, but it will load slowly and frustrate users.
The reporting solutions are not built around decision-making processes, but rather around the data itself. Because of that, we often see too many KPIs, too many detailed visuals — and ironically, more data, more information can cost less focus.
Tine Ozimič, Head of BI at Zebra BI, Why BI fails in the Last Mile Webinar
Real-world testing shows that reducing visual count from 20 to 8 elements can improve load times from 5 seconds to under 1 second.
Tools like Zebra BI for Power BI help by consolidating multiple KPIs into a single visual, reducing query load without losing insight.
Limit visuals per page
Keep visual count under 8-10 per report page. Each visual generates its own query against your data model, and too many simultaneous queries create bottlenecks.
Instead of creating separate visuals for each piece of information, look for opportunities to consolidate:
• Replace multiple individual cards with multi-value card visuals
• Use single tables to show relationships instead of separate table visuals
• Combine related metrics into comprehensive chart visuals
Reduce slicers and filter
While slicers make reports interactive, stacking too many pushes Power BI to coordinate complex filter relationships across the page.
Use small multiples
Instead of creating dozens of separate charts for different categories, use Power BI's "small multiples" feature to show the same information more efficiently.
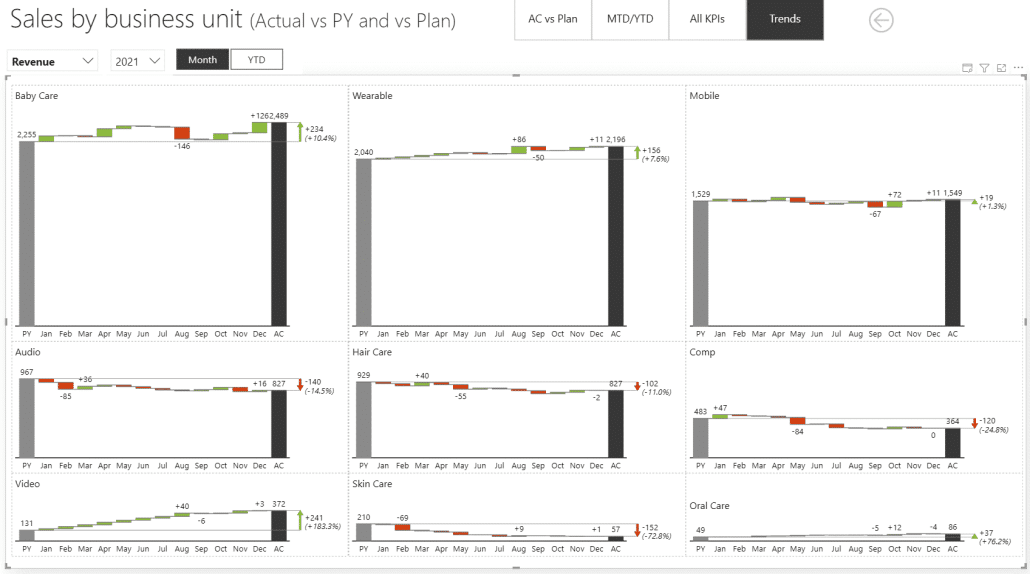
Testing shows that even reports with 144 individual charts can load in under half a second when properly designed with small multiples, a technique that would be impossible with traditional separate visuals.
Optimize visual interactions
When users click on one visual, it filters all other visuals on the page. While this creates an interactive experience, it also generates additional queries and calculations.
Disable unnecessary cross-filtering between visuals that don't need to interact.
Design landing pages for speed
Structure your reports with a fast-loading landing page that gives users an overview and lets them navigate to more detailed pages.
Users are willing to wait slightly longer for detailed analysis, but the entry point must load immediately to maintain engagement.
Filter pane vs. on-canvas slicers
On-canvas slicers run queries on every page load. A filter pane only triggers a query when you apply the filter.
Use on-canvas slicers for filters you interact with frequently, and keep the rest in the filter pane.
Field parameters: reduce visual count dynamically
Field parameters allow you to switch between measures or dimensions inside a single visual. Instead of having 3 charts showing sales by sales rep, product, and region, you build one chart and select what you want to see.
Drill-through as a performance design pattern
Drill through keeps your report pages fast by loading details only when you need them. When you need more information, it takes you to a separate page that’s built specifically for that level of detail.
Dashboard tile caching
Power BI caches dashboard tiles and displays the stored version instead of running the query again. The more requests Power BI can serve from cache instead of triggering a fresh query, the faster your dashboard loads.
To keep your cache rate high, pin visuals from reports, avoid tiles that depend on user-specific filters, and keep the data behind tiles as stable as possible between refreshes.
Add top N filters on large tables
When a table visual displays thousands of rows, Power BI loads and renders all of them, even if you only look at the top results. You can skip all the extra rendering with a Top N filter.
A Top N filter tells Power BI to only retrieve the highest or lowest N values based on a measure you define. For example, you can set it up to show the top 10 customers by revenue.
While your user experience stays exactly the same, the memory and query time it needs drop significantly.
Power BI Performance Monitoring and Governance
Optimizing your Power BI dashboard isn’t a one-time thing. A report that’s fast might slow down as the data volume grows, you add visuals, or the model evolves.
Here is how to stay on top of it:
Set documented performance standards
Define what a good dashboard looks like for your business and write it down. Decide how fast your landing pages, detail pages, and visuals should load.
Run regular performance reviews
Run a performance review after every major data model change for stable reports. If your dashboard refresh time keeps going up, it’s a sign that your model has changed and needs to be checked.
Monitor production performance
Refresh history and capacity metrics give you a clear idea of how reports are performing. You can use the Capacity Metrics app to get a detailed view of query duration, memory consumption, and CPU usage.
When something is slowing down, you’ll see it first here.
Train your report developers.
Most Power BI mistakes are the result of habits, not intent. A shared checklist for your team to review before publishing a report solves most problems before they get into production.
Quick Wins: How to Speed Up Power BI Dashboards Fast
You might be wondering, “So, how do I speed up Power BI dashboards?”
Here’s a list of Power BI performance optimization tips you can use, without a full model redesign:
- Run Performance Analyzer to identify the slowest visual on each page. Fix the worst offender first.
- Disable Auto Date/Time to immediately reduce model size.
- Remove unused columns from your fact tables. If it is not in a report, it should not be in your model.
- Reduce visuals per page to 8 or fewer.
- Replace on-canvas slicers with filter pane options where possible to reduce query load on page open.
- Switch calculated columns to measures wherever the calculation depends on a filter or user interaction.
- Enable incremental refresh for any large transactional table with growing row counts.
- Replace bidirectional relationships with single-direction relationships where possible.
- Use Import mode instead of DirectQuery where data freshness allows.
- Apply a Top N filter to any unfiltered table showing large row counts.
Speed up your Power BI Performance
When your dashboards load fast, people use them. Faster load times and leaner pages mean decisions get made on real data instead of gut feel.
Zebra BI for Power BI helps you do more with fewer visuals, so your dashboards stay fast as they grow.
Start your free trial of Zebra BI for Power BI today and see how optimized visuals transform performance.
And if you’re ready to go even deeper, check out our in-depth guide on Advanced Power BI Performance Tuning for expert techniques to squeeze maximum speed and efficiency from your reports.
Frequently Asked Questions
What causes slow Power BI reports?
Slow Power BI reports usually come down to a poorly structured data model, inefficient DAX calculations, too many visuals or slicers, broken query folding, or the wrong connection mode.
What is the best data model structure for Power BI performance?
The best data model is the star schema. It organizes data into a central fact table surrounded by dimension tables, which is how Power BI's engine is designed to work.
What tools can I use to diagnose Power BI performance issues?
To diagnose your Power BI performance issues, you can use Performance Analyzer, DAX Studio, Tabular Editor, and Capacity Metrics app in the Power BI Service.
How many visuals should a Power BI report page have?
Stick to 6 to 8 visuals per page. Each visual fires its own query every time the page loads, so the more visuals you add, the more queries Power BI has to handle.