Webinar recording
The Definitive Guide to Waterfall Charts

Join our webinar to

  • learn all about waterfall charts,
  • get plenty of ideas on how to use them in your reports and presentations and
  • ensure you can create the perfect one in Excel with Zebra BI in just 1 click.

What's included

Full video recording
Excel examples used in the webinar
Enjoy & thank you for watching! Don't hesitate to reach out if you have any questions — write to us at support@zebrabi.com!

Presenter

Andrej Lapajne

Founder & CEO at Zebra BI

Watch the Video

Get Excel Example
You can download the Excel file with examples from the webinar.
Access the materials
(0:50) Charts with horizontal axis
(0:51) Example: The McKinsey Way
(2:36) Example: Waterfall chart planning – bridge chart
(4:10) Example: EBITDA
(5:56) Charts with vertical axis
(6:01) Example: EBIT – negative effects
(7:17) Example: Displaying costs – better overview of the structure
(8:48) Example: Pocket price/Pocket margin – multilevel calculations
(10:35) Example: Accounts receivable
(12:27) Example: Forecasting – Cashflow report
(16:01) Example: Multiplying charts – quarterly growth
(18:36) Example: Profit and loss statement – subcalculation reporting
(23:17) Short Profit & Loss statements
(24:42) Monthly variances and YTD value
(26:33) Displaying contributions – structure chart
(28:33) High information density report
(29:59) 2 Types of contribution analysis: Categories/Structure vs. variance
(30:39) Creating waterfall chart
(31:48) Inserting and editing category class column
(32:52) Editing chart style: Colors, shapes, labels
(37:00) Creating and editing bridge chart
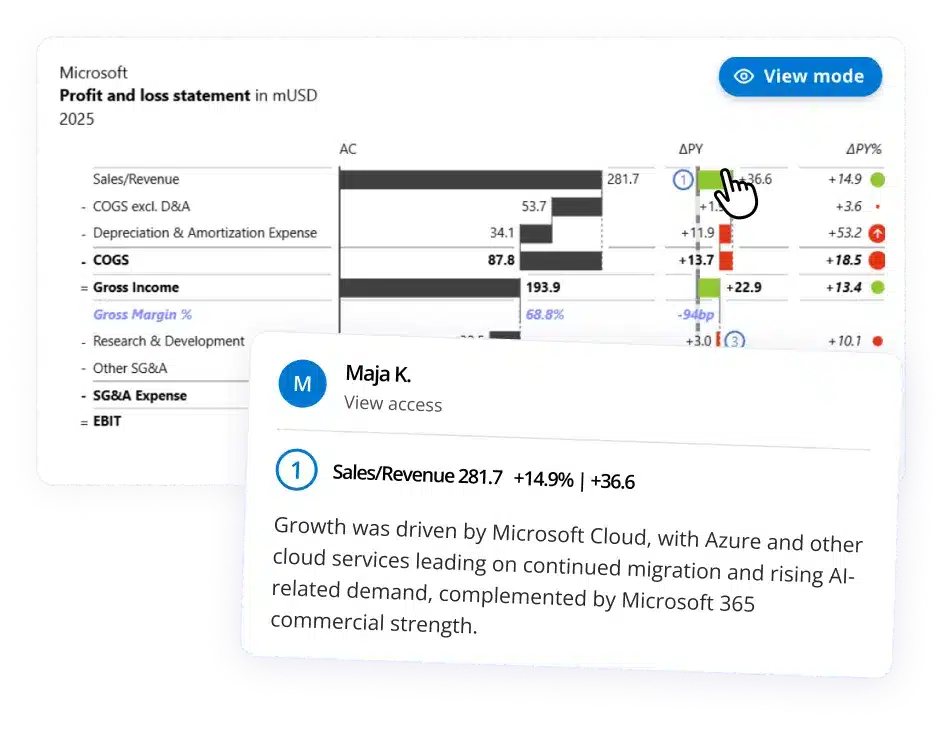
(38:33) Adding comments
(38:56) Exporting charts to the PowerPoint
(39:43) Creating charts from transposed tables
(40:25) Growing charts: Inserting rows and columns
(41:57) Creating Profit & Loss Statement - subcalculations
(44:09) Specifying subtotal
(46:29) Aligning and scaling charts
(47:30) Creating multiple charts at once
(48:29) Editing style and layout of multiple charts
(50:04) Creating Cashflow statement: Using and editing layout templates
(53:50) Creating forecast charts
(54:50) Fitting charts to the layout
(55:45) Adding comments, titles and other remarks
(58:30) Zebra BI resources and social media presence
(59:23) Q & A
Share this

Prefer written step-by-step instructions?

Read the Article

Ready to start uncovering actionable insights from your data?

Explore Zebra BI for Office and Power BI, or start a trial instantly and test our tools on your data. You can also contact us to help you build your first test report and create a custom package for your business.

More Trending Webinars

Upcoming
December 3, 2026
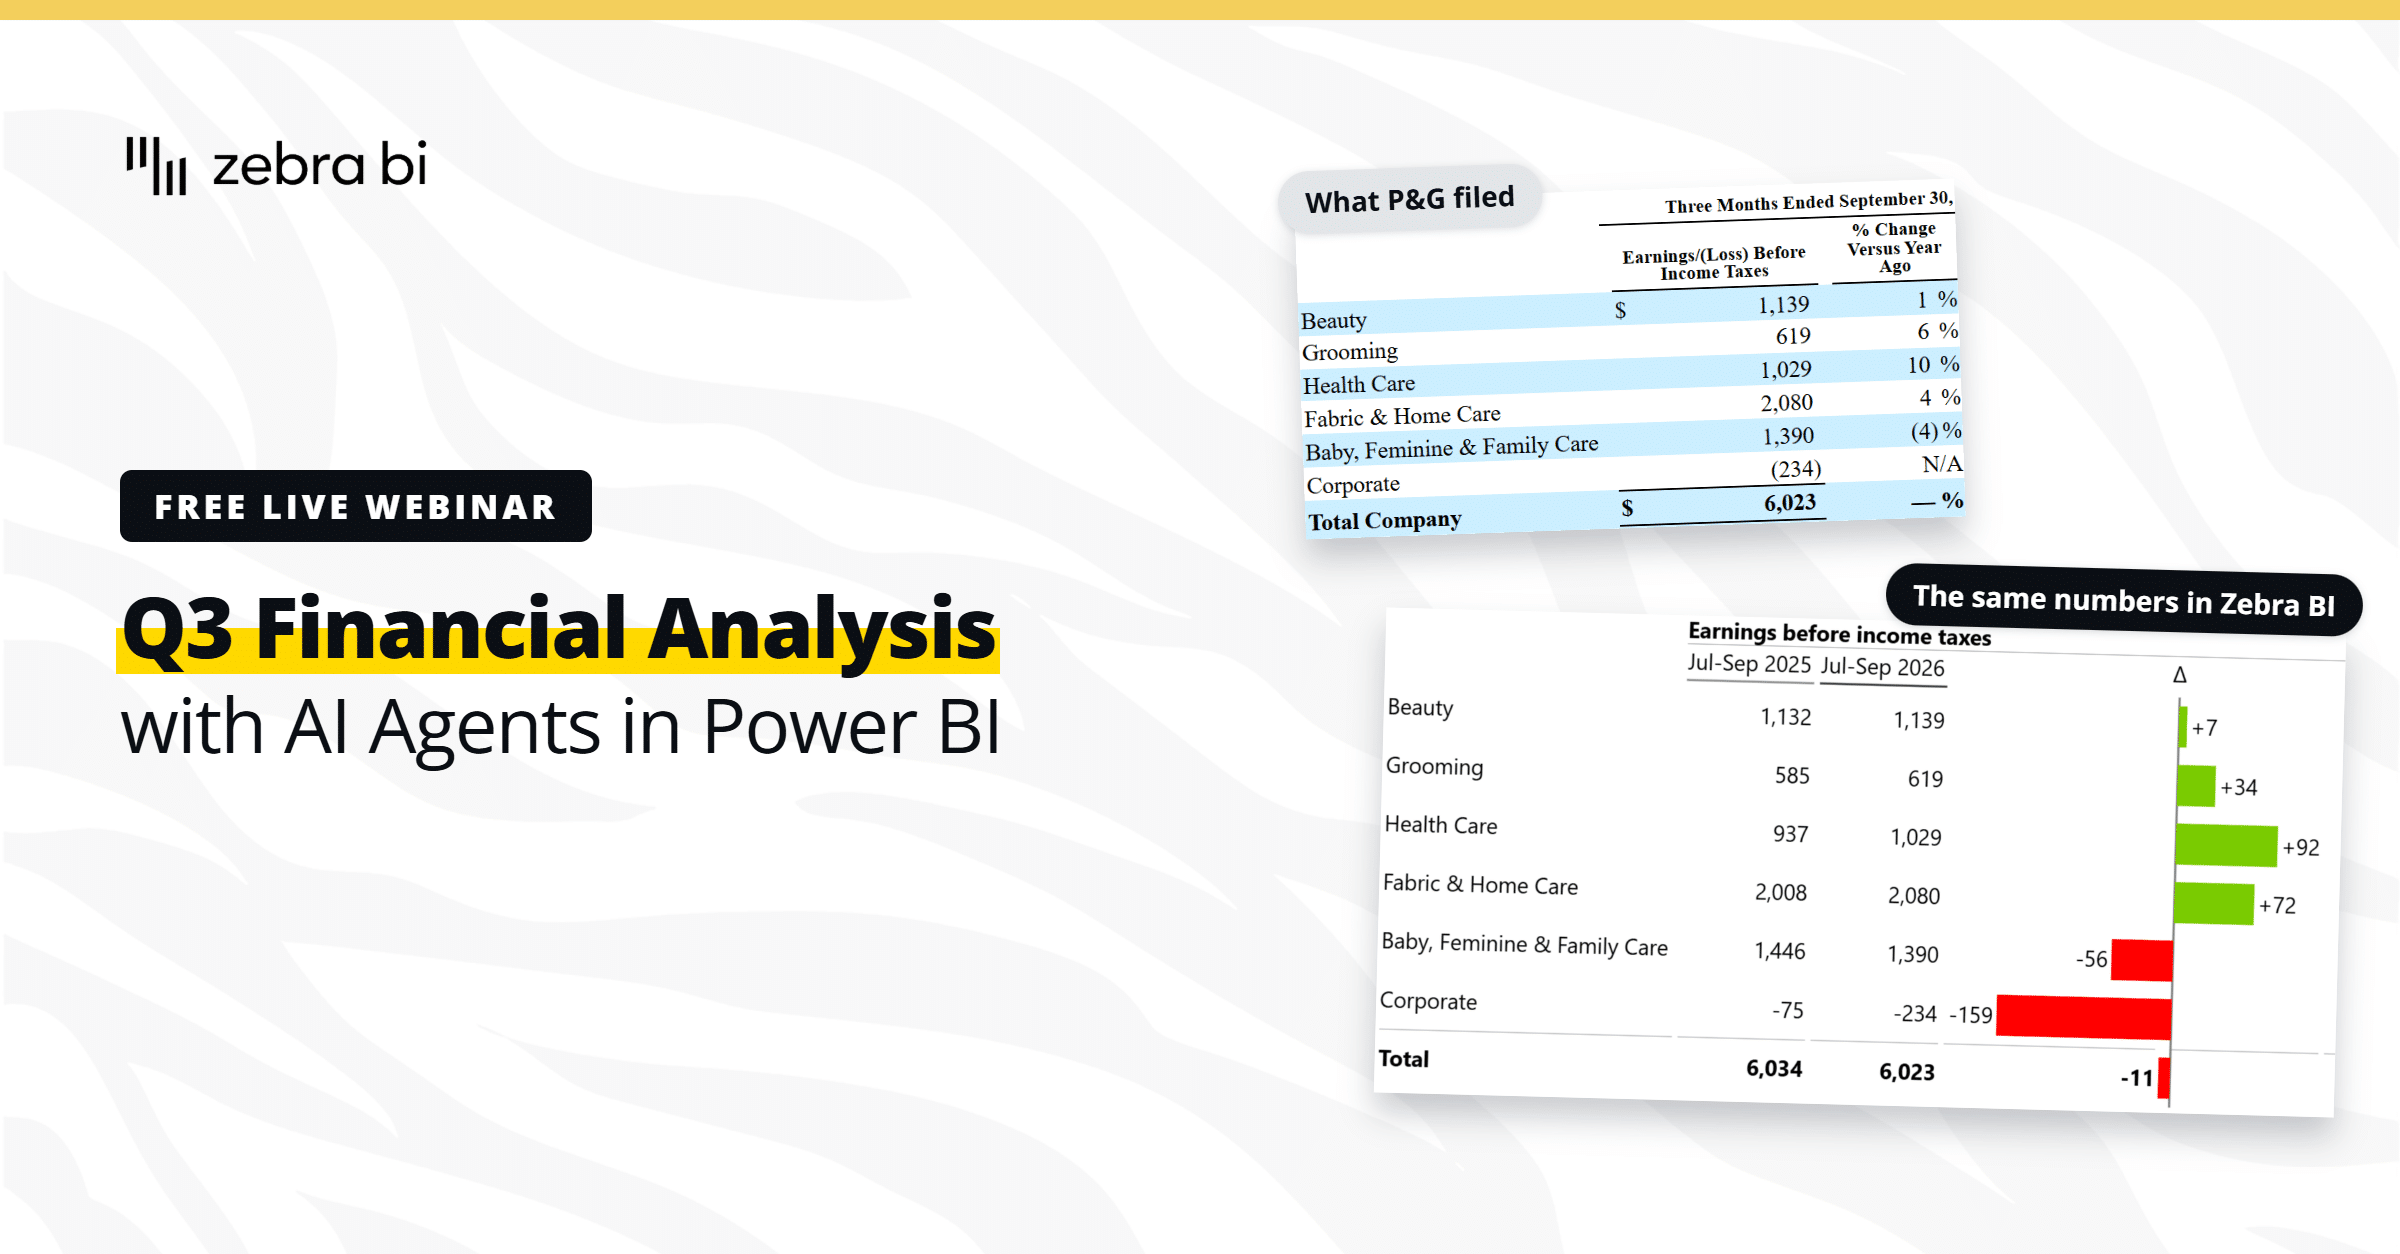
Q3 Financial Analysis with AI Agents in Power BI
Free live webinar, 3 December: Zebra BI agentic builds a Power BI report on Q3 numbers from 10 US companies, with the why next to the number.
Register
October 27, 2026
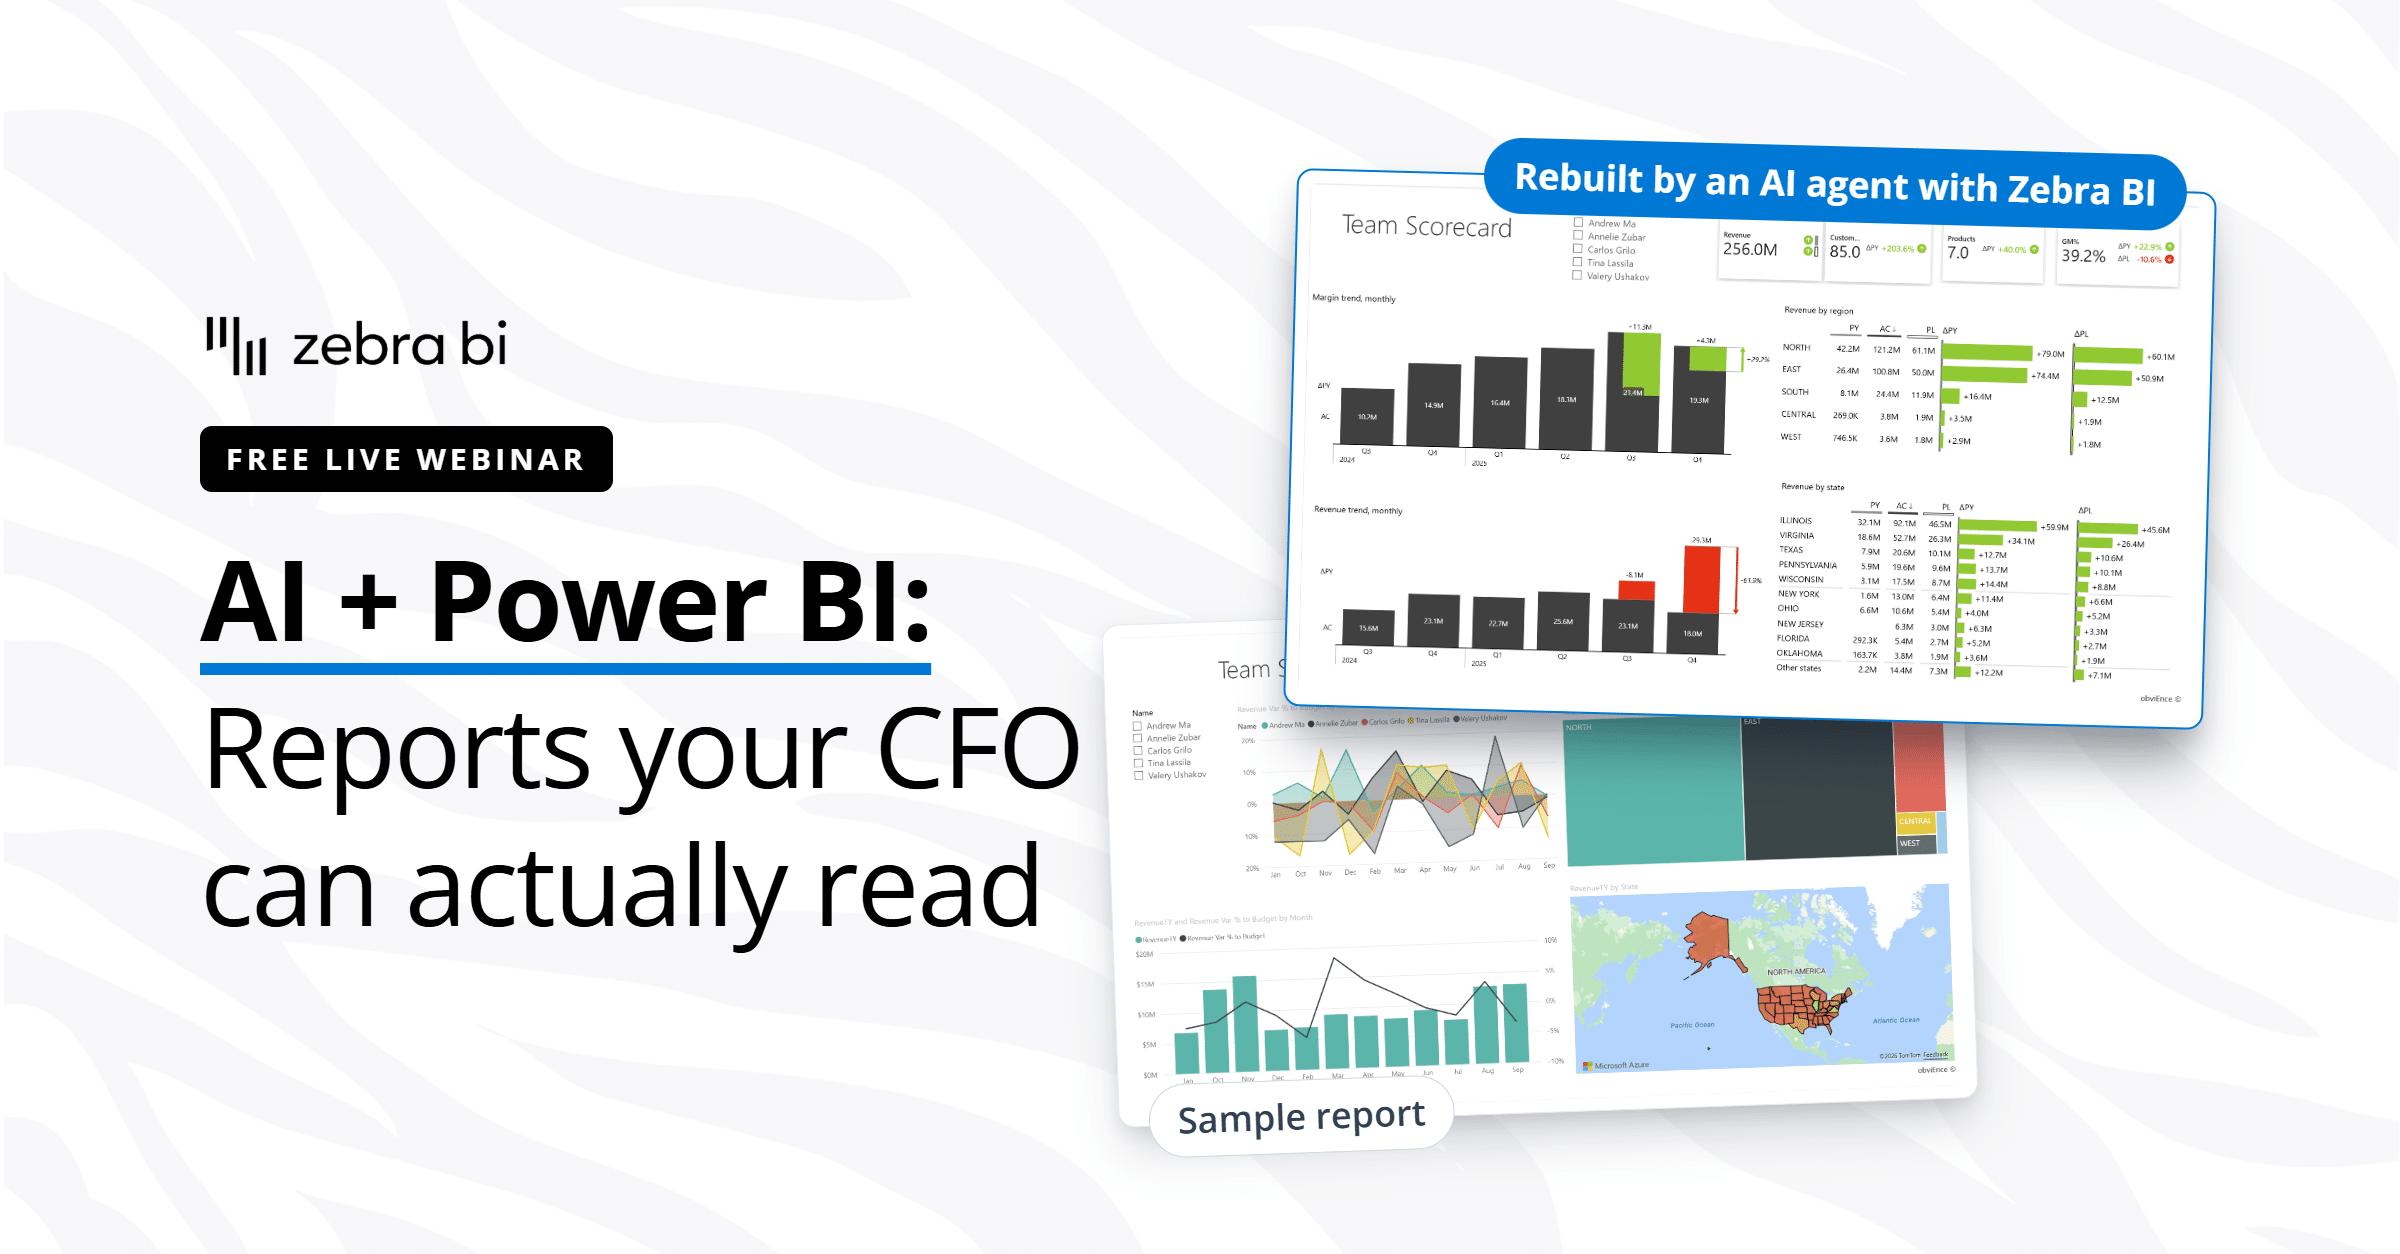
AI + Power BI + Fabric: Reports your CFO can actually read
Free live webinar, 20 October: watch an AI agent rebuild a Power BI report with Zebra BI visuals, and see what Zebra AI adds in Microsoft Fabric.
Watch now
September 24, 2026
Zebra BI Partner Pulse Webinar
A new webinar series for Zebra BI partners — get the latest updates, explore new tools, and stay closely connected with the Zebra BI team.
Watch now
September 15, 2026
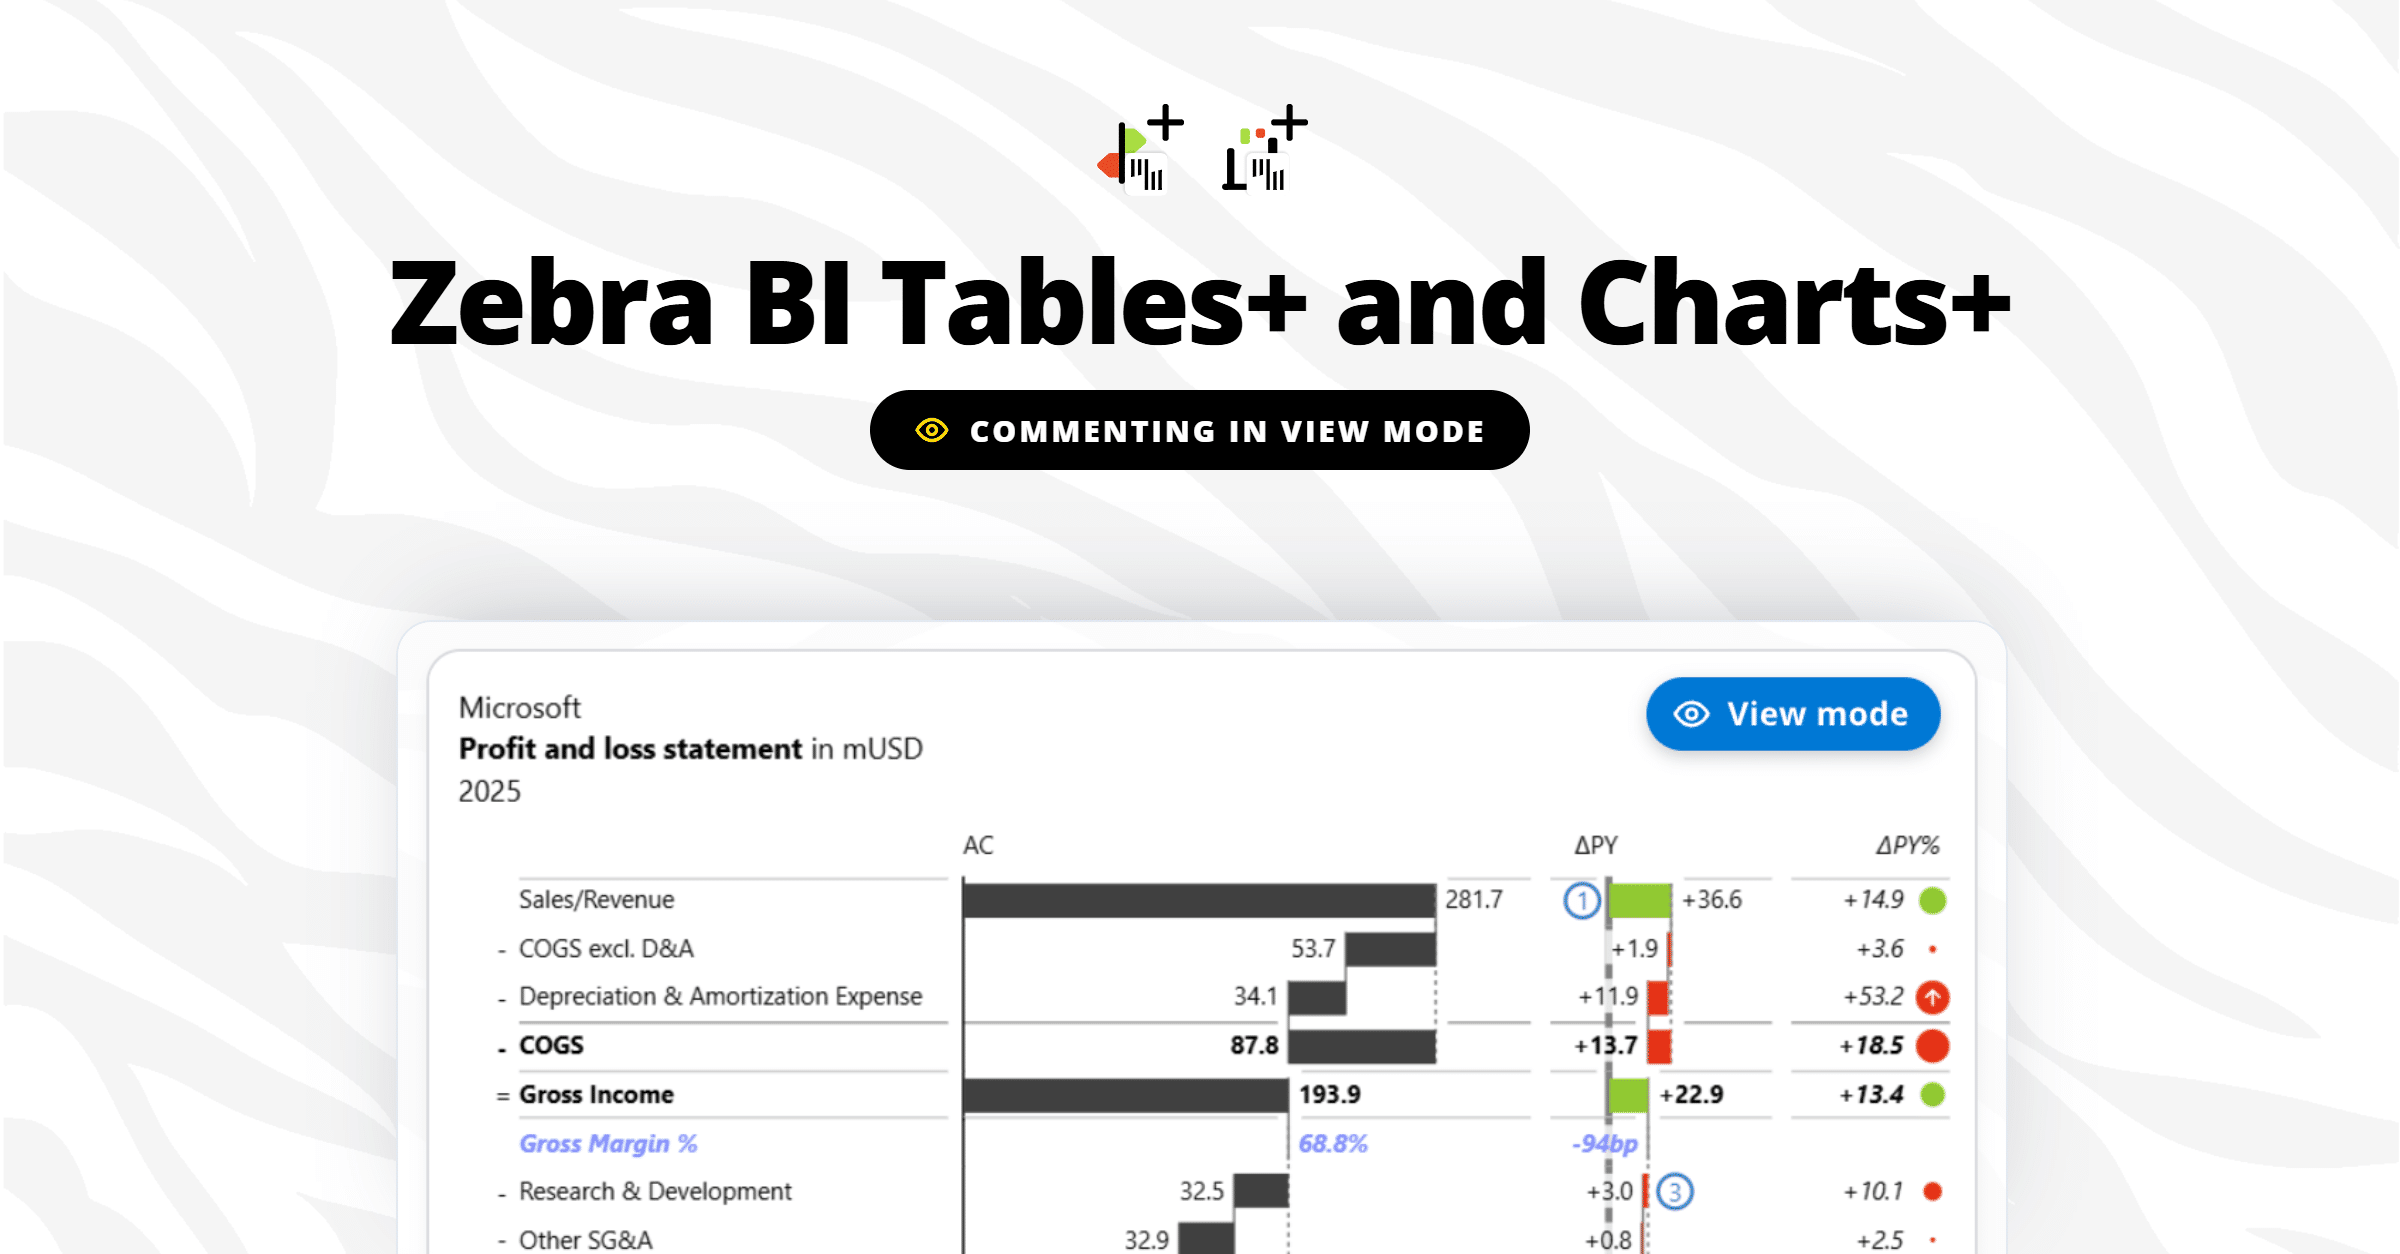
Introducing viewer commenting in Power BI: Zebra BI Tables+ & Charts+
Report viewers can finally comment right on the data, in view mode, with no Power BI edit access. Andrej Lapajne and Mark Leskovšek launch Zebra BI Tables+ and Charts+ live on a real report, then take your questions.
Watch now
June 4, 2026
Dashboards vs AI: Live Analysis of 100 S&P Company Financials
Finance teams are debating dashboards vs AI. We're not going to debate. We're going to show. On June 4, we walk through 100 real company P&Ls (Nike, Tesla, Pfizer, Walmart, Amazon) across 6 industries and 6 years of public financial data, live, in a single report. See what great financial reporting looks like at scale.
Watch now
March 26, 2026
How teams cross the Last Mile
Your reports are ready. Decisions aren't. Learn how to close the Last Mile - live Power BI build, real client case, actionable framework. Free, 60 min.

Watch now
Browse All Resources

New: Zebra BI Tables+ and Charts+

Everyone can comment on the report. No edit rights needed.
See the new visuals
viewer commenting in zebra bi
Matija Prijatelj
BI Specialist