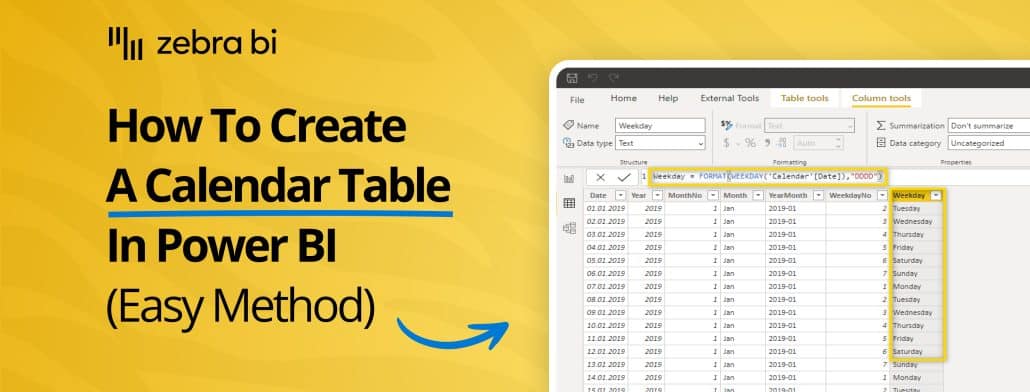
Time-based analysis is at the heart of financial and business reporting. Whether you're tracking sales by month, comparing year-over-year growth, or analyzing quarterly performance, your reports rely on dates to tell the story behind the numbers. There's good news about this, and there's not-so-great-news. We'll start with the not-so-great ones: Power BI comes with a […]
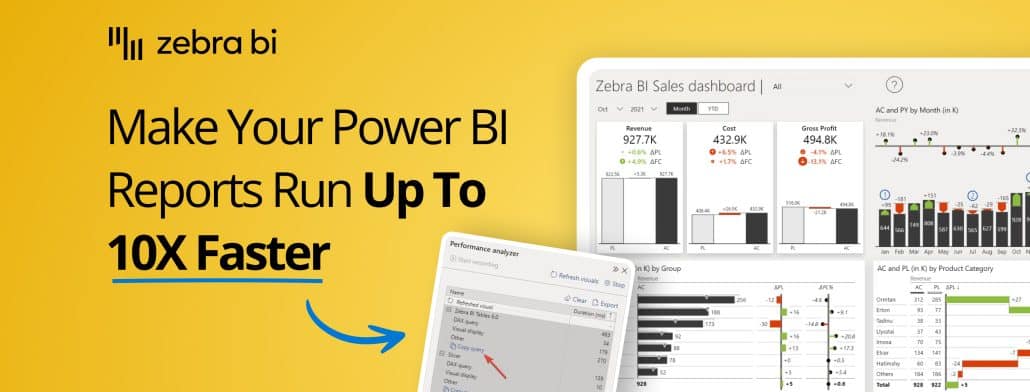
We've all seen slow Power BI reports. You know, reports that just take forever to load the visual. We're talking 5, 20 seconds or even a minute and more which makes them completely useless. And that's just why Power BI performance optimization is extremely important! Here's the thing... Speed, and thus performance, has a huge […]
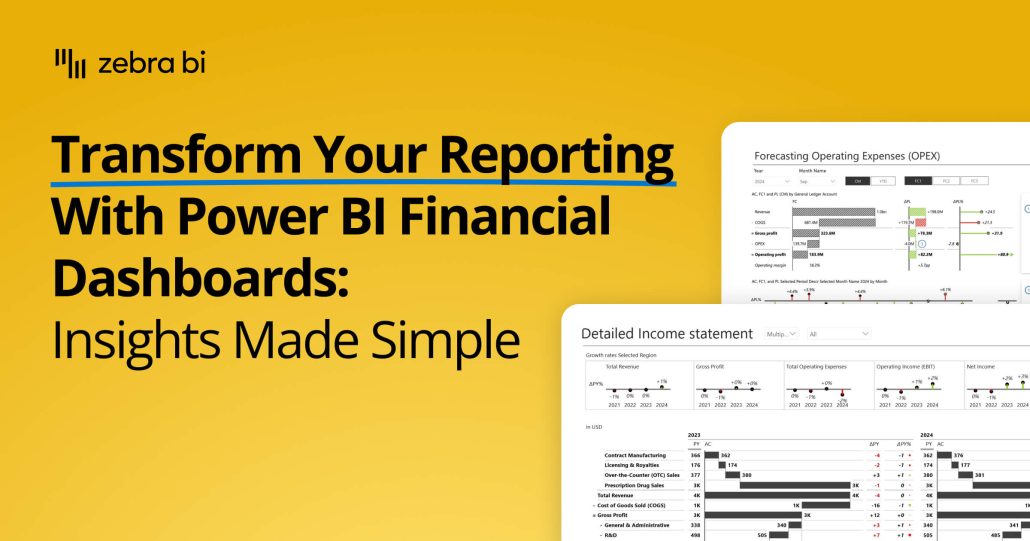
Traditional reporting is broken. It's time-consuming, does little to help with siloed data, and often, it doesn't provide stakeholders and leadership with meaningful insights from their reports. The good news? While traditional reporting may be dead, there are modern, engaging, and actionable alternatives. And they don't have to be difficult to attain either. In our […]
Not sure where to start with your Power BI sales dashboard or how to optimize it? Here is a comprehensive guide that will help you make the most out of your sales data!
Get a better grip of your annual statements across multiple years and regions -- all in a clean, actionable way even business stakeholders outside of the Financial Department can decipher.
 September 8th
 Don’t miss the best offers of the year!
 February 22nd