The Ultimate 2024 Bar Chart Guide
If you've been looking for a way to represent data concisely and impactfully, you've come to the right place. Whether you are a seasoned analyst, a budding entrepreneur, or just looking to make sense of numbers, our guide to creating the most effective bar chart will provide invaluable insights.
Bar charts, or column charts if we're talking about their vertically arranged cousins, are a visual storyteller's best friend. They strip down complex data into easily digestible, bite-sized information nuggets. Imagine comparing the annual sales figures of different product categories from text alone—it's not just tedious, it's a recipe for confusion. Now picture those exact figures presented as a bar chart, each category with its vertical bar, their heights effortlessly illustrating the comparative success of each. That's the magic of a bar chart.
But like any powerful tool, creating an effective bar chart requires understanding and skill. That's where we step in. This guide will introduce you to the world of bar charts and take you on a tour of creating them using two platforms: Excel, a tool many of us are familiar with, and Zebra BI, a software that upgrades data representation to a whole new level.
With that said, get ready to dive into the world of bar charts, where data meets design and information is as clear as black and white. Let's start our journey to create the perfect bar chart that will captivate your audience and deliver your data story in the most compelling way possible.
Want to skip all the fuss and create perfect bar charts in seconds?
Creating advanced visualizations has never been easier! Try Zebra BI for Office with your data for free and upgrade your reports.
Types of the bar chart
In data visualization, not all bar charts are created equal. Depending on the data you're dealing with and the story you want to tell, you may find different types of bar charts more suitable. Here, we will focus on the two most common types: bar charts and column charts. While these terms are often used interchangeably, they refer to distinct chart orientations that can impact your data's readability and interpretation.
Bar chart
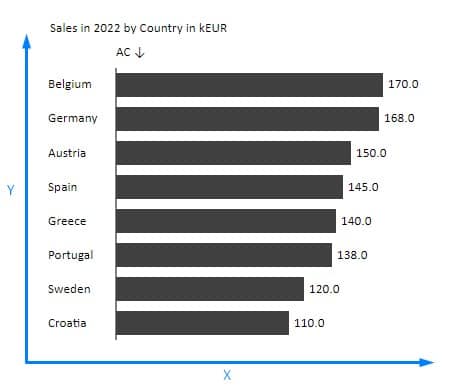
The traditional bar chart presents data in horizontal bars, with the length of each bar corresponding to its data value. The categories you are comparing are usually listed vertically on the y-axis, while the numerical scale is plotted horizontally on the x-axis.
This format is especially useful when you have long or many category labels. Why? Because it's easier for the human eye to read text from left to right. A horizontal layout provides ample space for this. Moreover, when dealing with structural data—like different cities, countries, or types of revenue—the International Business Communication Standards (IBCS) recommend using a vertical axis, making bar charts the go-to option.
Column chart
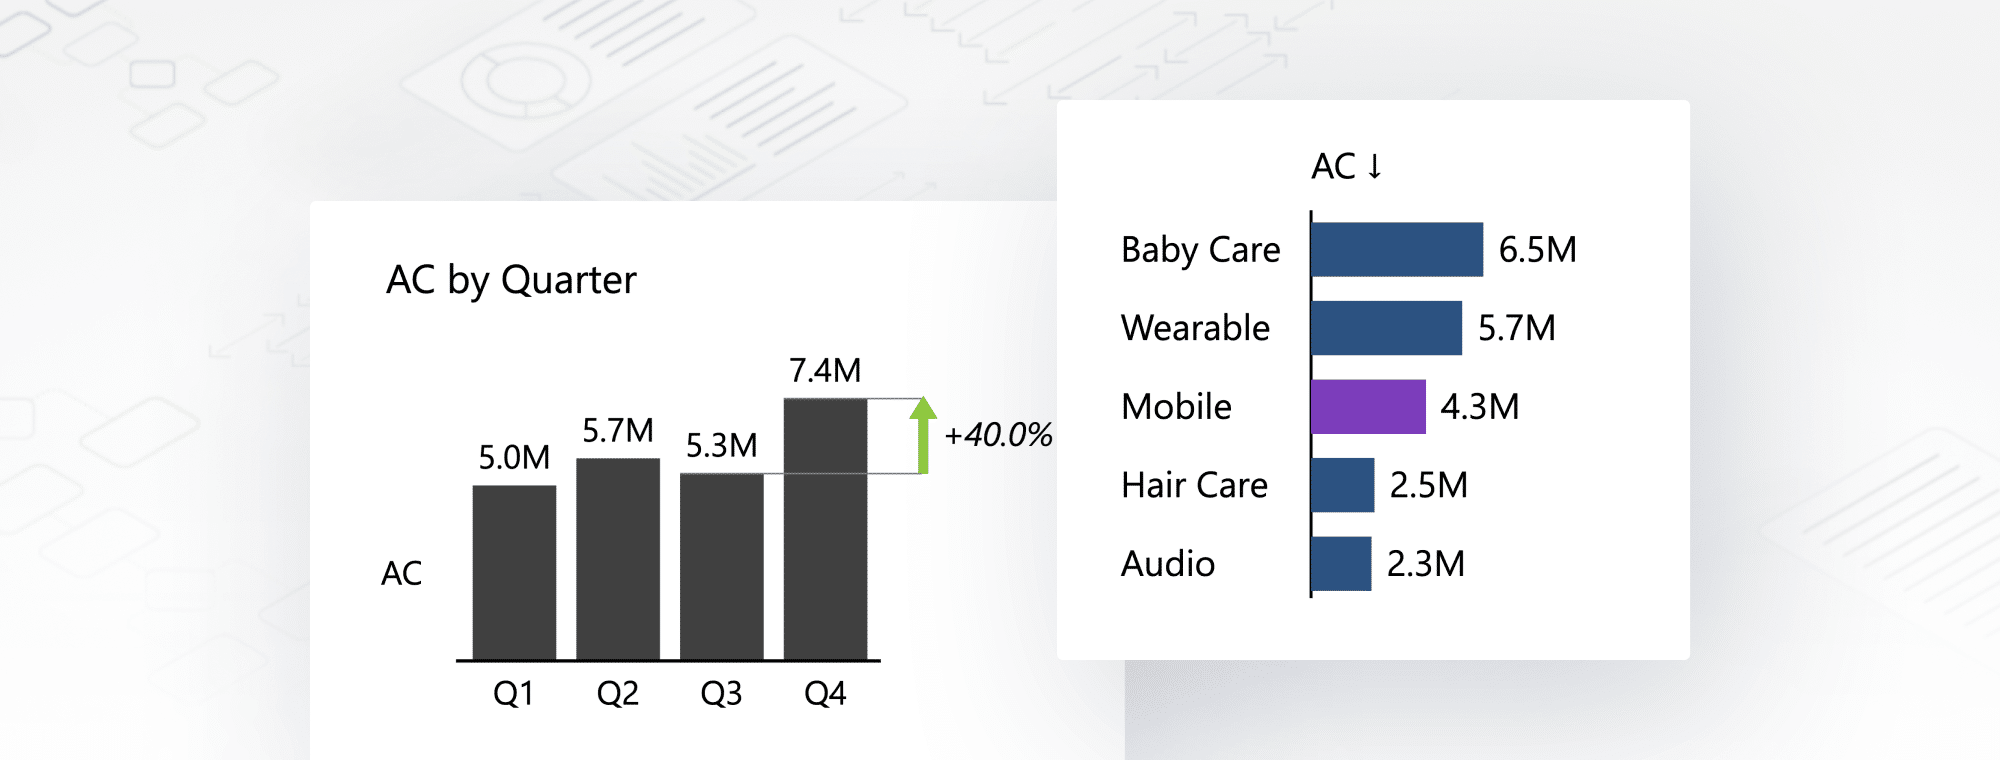
On the other hand, a column chart is a vertical bar chart. Here, categories are plotted along the horizontal x-axis, while the numerical scale runs vertically along the y-axis. The height of each column signifies its data value.
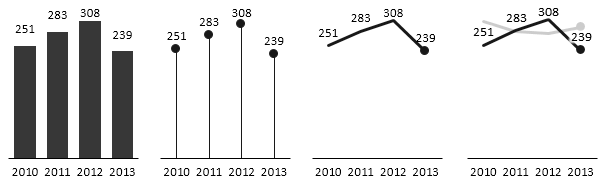
Column charts are ideal when categories are fewer and labels are shorter. They are also beneficial when you emphasize values progression, as our eyes naturally scan from left to right. Importantly, column charts are particularly suited to time series data—such as months, years, or quarters—which the IBCS suggests should be plotted along a horizontal axis.
Understanding the subtle differences between bar and column charts is essential. The choice between them comes down to the nature of your data and the message you want to communicate.
Read more: How to choose the right chart
In the following sections, we will walk you through the process of creating each type using Excel and Zebra BI, so you can see these differences in action and understand how to choose the right one for your specific needs. Buckle up—it's time to bring your data to life!

Components of a bar chart
Despite their simple structure and intuitive design, bar charts dominate data visualization. However, to effectively create and interpret these charts, it's crucial to understand their fundamental components:
Title
The title is at the top of the chart. It provides a concise summary of the data being visualized. A well-written title is brief, descriptive, and accurately represents the data.
Bars
These are rectangular shapes that represent data values. The bar height corresponds to the data's magnitude in a vertical bar chart. Conversely, the bar length reflects the data value in a horizontal bar chart.
Axis
Bar charts have two axes. The x-axis (horizontal) typically represents values, while the y-axis (vertical) represents categories. Depending on the chart type, this can vary. For example, in a column chart, categories are on the x-axis, and values are on the y-axis.
Scale
This is the range of values on the x-axis (or the y-axis for column charts). The scale should be appropriate for the data being presented. Importantly, bar charts usually start at zero to avoid misleading visuals.
Note: Proper scaling is critical in producing reliable and accurate reports.
Labels
Data labels are there to effectively complement the charts, meaning they need to be clear, correctly placed, and use consistent formatting. Both in Excel and Zebra BI, labels can be customized to fit your needs.
Legend
If your bar chart includes multiple data series (e.g., data from different years or multiple variables), a legend is used to distinguish between them. Each data series will have a different color or pattern, as explained in the legend.
By understanding these components, you're well-equipped to create accurate, clear, and effective bar charts. The beauty of bar charts lies in their simplicity, but remember, each component plays a crucial role in accurately representing and interpreting your data.
Common mistakes when creating bar charts
Creating bar charts might seem straightforward, but some common pitfalls can detract from their effectiveness. Let's go through some of these mistakes and how to avoid them:
Inconsistent or misleading scales: One common mistake is not starting the Y-axis at zero. This can make differences appear more dramatic than they are and can be misleading. Always start your scale at zero unless there's a strong reason not to.
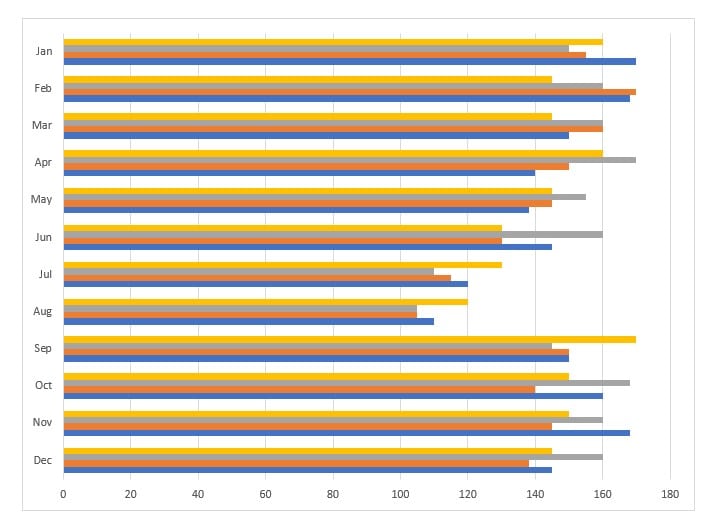
Overcrowding: It can become crowded and difficult to interpret if you try to fit too many bars into a single chart. Consider grouping related data or using a different chart type if you have many data points.
Neglecting to label axis: Always remember to label your axes. This provides context for your data and makes your chart easier to understand.
Overuse of colors: Using too many different colors can be confusing and detract from the data you're trying to present. Stick to a consistent color scheme, and remember, Zebra BI can help with this with its unified color-coding feature.
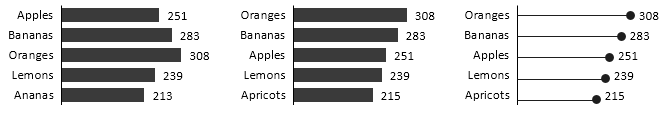
Not ordering bars logically: Unless you're working with a time series, it's generally wise to order bars ascending or descending to make comparisons easier.
Ignoring negative values: If your data includes negative values, don’t ignore them. They can contribute to your data's story.
Remember, your chart's ultimate goal is clearly and accurately representing your data. You'll create compelling and impactful bar charts by avoiding these common mistakes.
Introduction to Zebra BI: Enhancing your bar charts
Imagine this scenario: You're crafting a bar chart in Excel, manually calculating variances, spending precious time fine-tuning the design, and hoping your chart conveys clear insights. This is where Zebra BI comes into the picture as a game changer.
Zebra BI is a powerful Excel add-in that makes creating high-quality, professional-looking bar charts a breeze. Here are some ways Zebra BI enhances your chart creation process:
Automated variance calculations: Zebra BI's standout feature is its ability to calculate variances automatically. No more manual computations or errors - Zebra BI does the math for you. This feature is a massive time-saver and ensures accuracy in your data visualization.
Standardized reports: Consistency is key in data visualization. Zebra BI helps you maintain a standardized look across all your reports, promoting clarity and reducing confusion. Whether preparing a presentation for stakeholders or sharing data within your team, Zebra BI guarantees your visuals are consistent and professional.
Unified colors and indicators: Zebra BI uses a unified color-coding system to indicate good, bad, and neutral results, making your charts easier to interpret. This clear visual language helps you quickly assess your data's story.
Flexible chart layouts: With Zebra BI, you're not locked into a single chart layout from the beginning. You can experiment with various layouts - actual, integrated, absolute variances, and comparisons - all within a single visual. This flexibility allows you to find the most appropriate way to represent your data.
Time-saving features: Zebra BI streamlines your chart creation process. It reduces the time you'd otherwise spend on additional measures, giving you more time to analyze and interpret your data.
Understanding these core benefits of Zebra BI provides you with a foundation for the next steps. Once you've grasped the essential features, you can dive deeper into the advanced capabilities of this tool, significantly elevating your bar charts' quality.
Not sure where to start?
Take a look at our 30+ free Excel templates!
How to create a bar chart in Excel
Creating a bar chart in Excel is like learning to play guitar chords. Once you've learned the basics, you'll find countless ways to use them. Let's dive in.
Step 1: Prepare Your Data
The first step in creating a bar chart is to organize your data. You'll need a table that displays your categories and their corresponding values. Make sure your data is clean and accurate.
Step 2: Select Your Data
Click and drag to select the cells containing the data you want to include in your chart. Remember to include column headers or row labels so Excel understands what each data series represents.
Besides manually selecting a data range, it’s considered best practice to format your data as a Table for several reasons.
- When you add new data rows or columns to a table, Excel automatically expands the table range to include the new data. This dynamic range expansion ensures that any formulas, charts, or references based on the table are automatically updated to include the new data. It saves time and effort by eliminating the need to adjust formulas or ranges manually.
- Tables in Excel provide built-in sorting and filtering functionality.
- Excel automatically assigns a structured name to each column in a table, making it easier to reference specific columns in formulas and calculations. This reduces the chances of errors when writing formulas
Lastly, we must create pivot tables to present summarized data from large data sets visually. Excel supports the creation of charts and pivot tables. These tables provide a drag-and-drop interface, allowing you to easily change the arrangement of rows, columns, and data fields. You can quickly switch between different dimensions to view data from various perspectives. Pivot tables summarize data by grouping it based on one or more columns. They are dynamic, meaning they automatically update when the underlying data changes. Pivot tables allow data filtering on rows, columns, or individual data fields, making drilling down into the data and analyzing specific segments very simple.
Step 3: Insert a Bar Chart
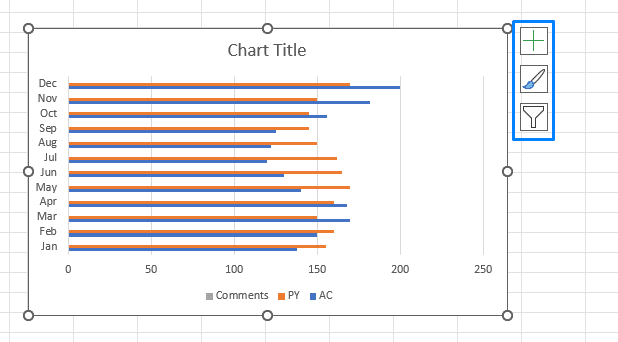
Head to the "Insert" tab on the Excel ribbon. Click on the "Bar Chart" icon in the "Charts" group for a drop-down menu with different bar chart options. For now, choose "2D Clustered Bar" for a horizontal bar chart or "2D Clustered Column" for a vertical bar chart.
Step 4: Customize Your Chart
You can modify and format the existing charts' titles, axis titles, data labels, styles, colors, and more on the “Chart icons“ on the right side of the chart and the Chart Design tab on the Excel ribbon.
That's it! You've created your first bar chart in Excel. But this is just the beginning. As you gain more confidence, you can explore more complex chart types and customization options.
In the next section, we'll look beyond Excel's native capabilities and introduce you to Zebra BI's enhanced charting options. The transition is easier than you might think, and the results can be transformative. So, let's keep moving forward on your data visualization journey!
How to create a bar chart with Zebra BI
We’ve already briefly described the true power of Zebra BI, and now it's time to walk through the process of creating a bar chart using this advanced tool. The steps are surprisingly similar to those in Excel but with added enhancements that will elevate your data visualization.
Step 1: Download the Zebra BI Add-in
To begin with, make sure you have downloaded the Zebra BI add-in in Excel.
Step 2: Prepare Your Data
Just like in Excel, you'll need a well-organized data table. Clean, accurate data is always necessary for impactful charts. Zebra BI Add-ins work with various formats, from ranges, Excel tables, and pivot tables.
Step 3: Insert Zebra BI Add-in
Select your data using a range format, or click on any cell within the Excel table/pivot table and navigate to the Insert tab on the Excel ribbon. In the Add-ins section, press on the down arrow by My Add-ins and select Zebra BI Charts for a vertical-oriented chart, equivalent to a column chart, or Zebra BI Tables for a horizontal chart, recognized as a bar chart.
Zebra BI Add-ins also offer a built-in guide for rendering a perfect chart for your data type: Chart chooser/Table chooser. Go to an empty sheet and insert a Zebra BI Add-in as described above. A dialog box will appear showing various chart types. Hover over each chart for a description and decide which best suits your data. Once you've made your selection, click "OK."
Step 4: Customize Your Chart
Zebra BI charts have many customization options. You can adjust the chart title, axis titles, add data labels, and more using the Zebra BI tab options.
Step 5: Leverage Zebra BI's Powerful Features
Here's where Zebra BI shines. Use its advanced features to automatically calculate variances, switch between chart layouts, and apply unified colors.
Keep in mind that the visual presentation of your data needs to stay clear and understandable try not to overcrowd the chart with unnecessary information.
And there you have it! You've created a bar chart using Zebra BI, stepping up your data visualization game. As you become more comfortable with Zebra BI's unique features, you'll be able to bring out the best in your data, presenting it in a way that's not just informative but genuinely engaging. Keep experimenting, learning, and pushing your data to new heights.
Advanced Features of Zebra BI: Maximizing Your Charting Potential
You've seen Zebra BI's foundational features and how they can upgrade your bar chart creation process. Now, let's delve into the advanced features that enable you to fully harness Zebra BI power and take your data visualization to the next level.
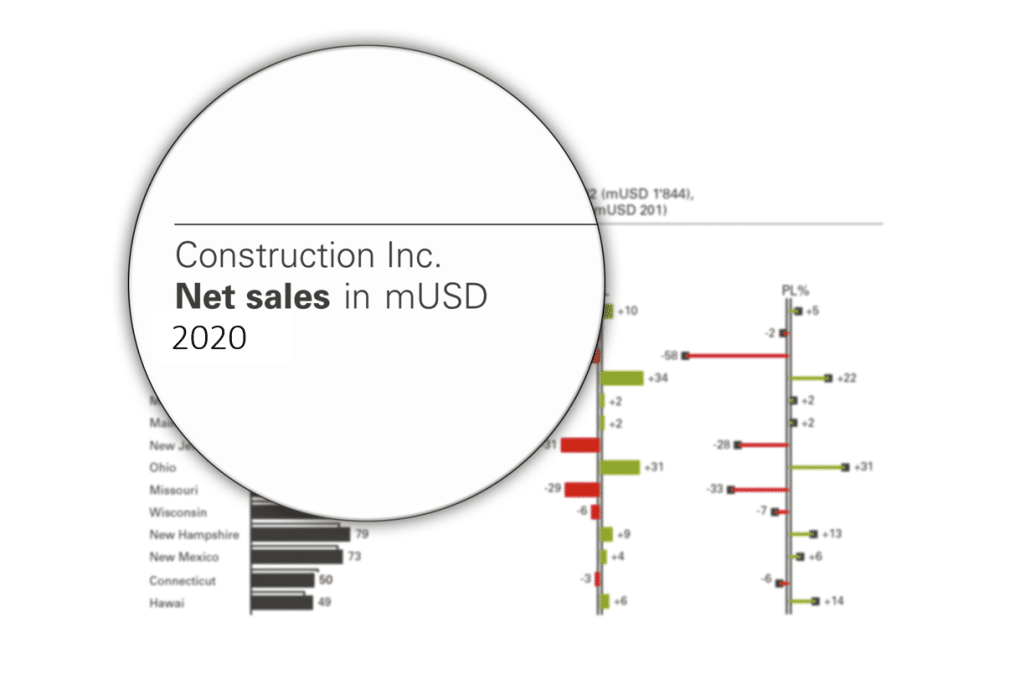
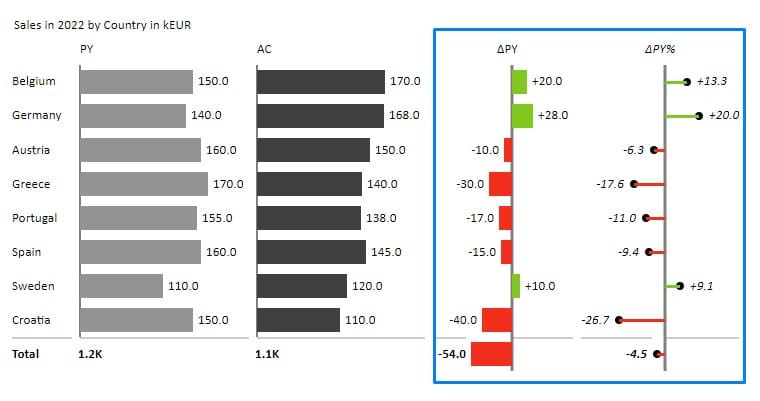
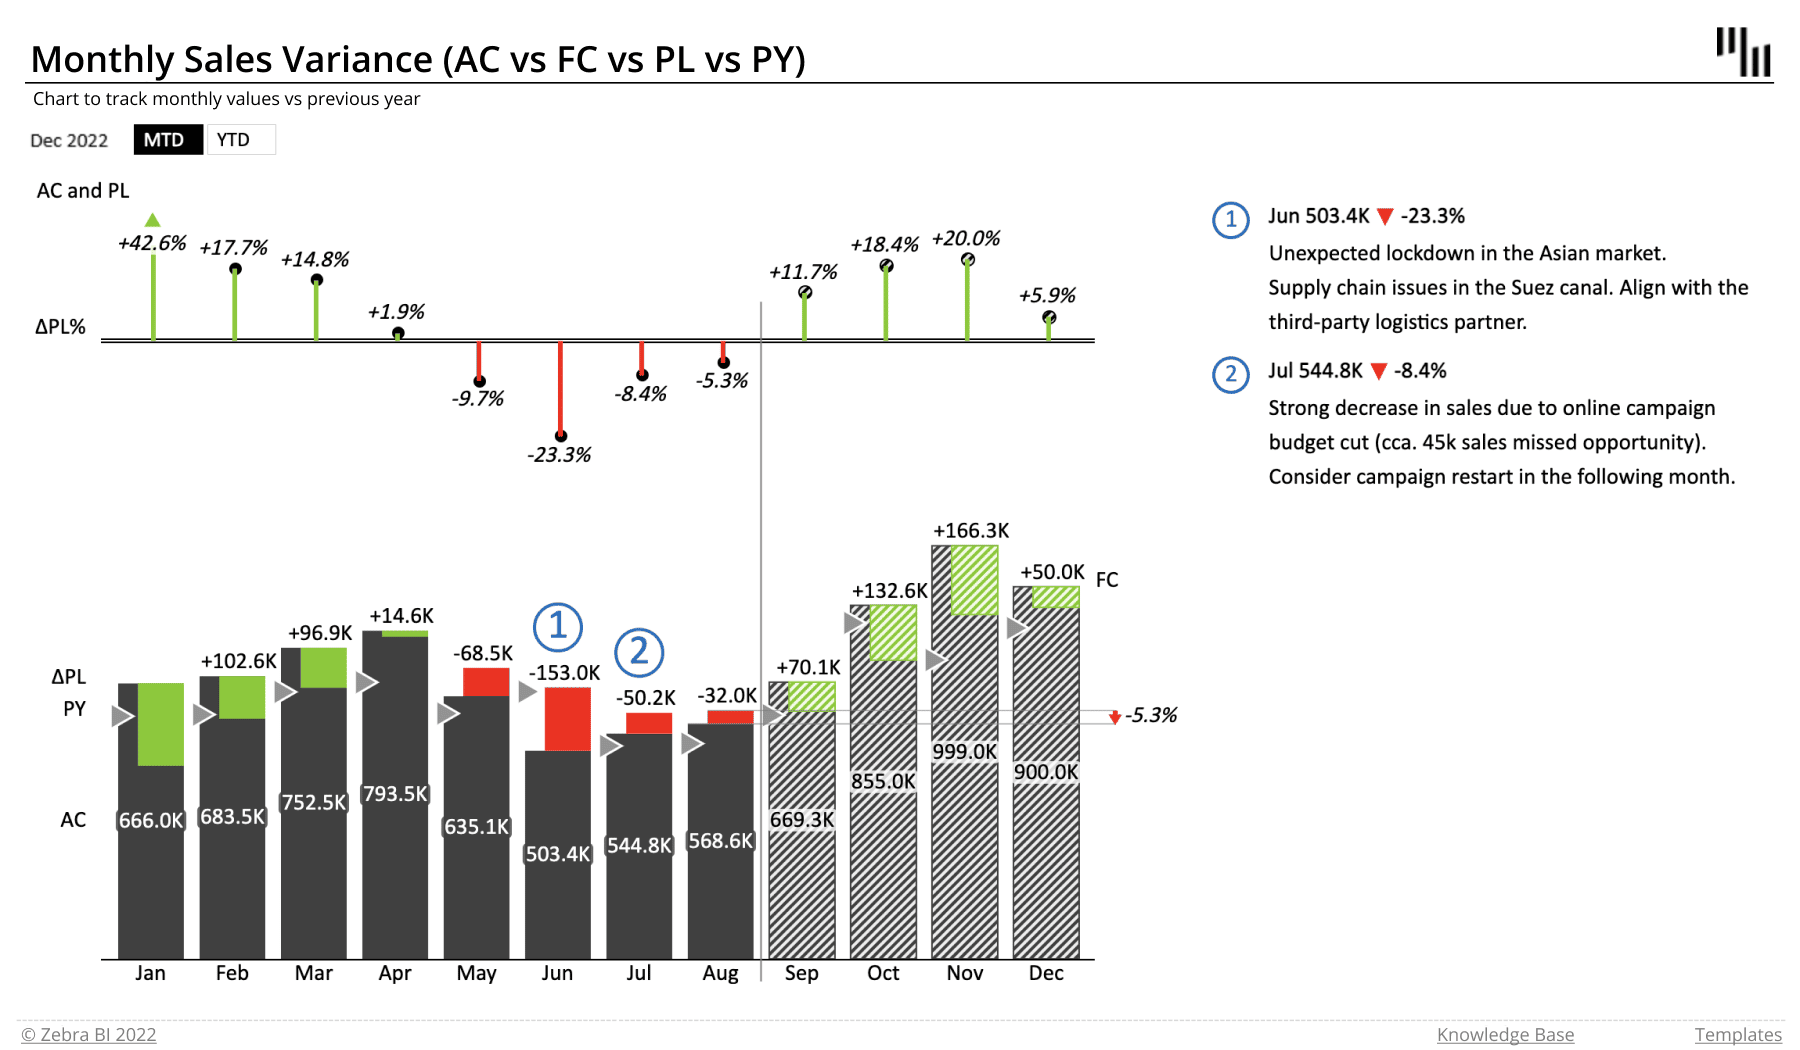
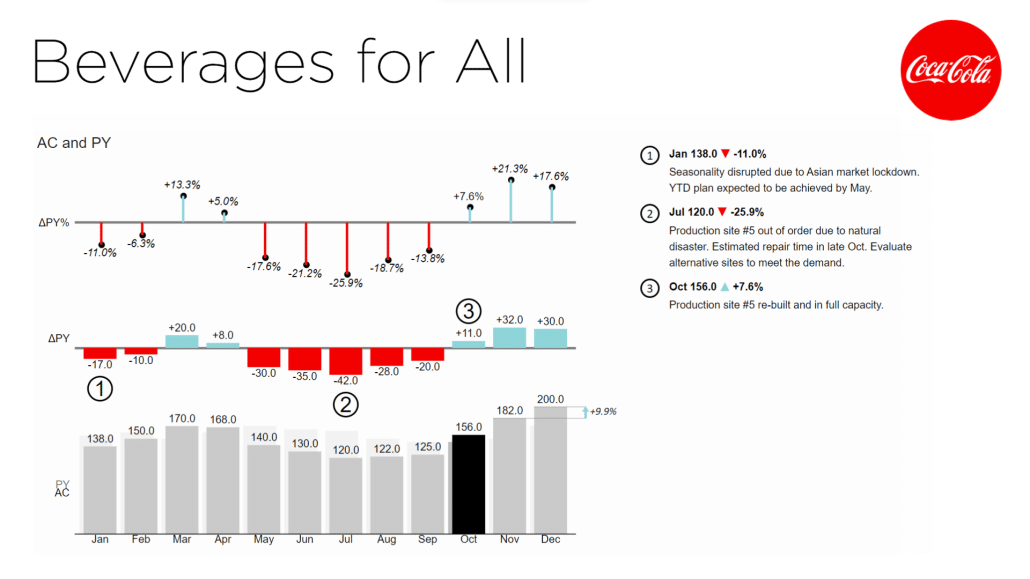
Advanced Variance Analysis: Beyond basic variance calculations, Zebra BI offers advanced variance analysis features, including absolute, relative, and index variances. These comprehensive tools provide a deeper understanding of the differences between your actual and planned data.
For calculating automatic variances, Zebra BI allows comparisons for up to 4 different scenarios, meaning you can compare your actual values (AC) to the Previous period (PY), Budget or Plan (PL), and Forecast (FC), all in one bar chart. Additionally, when presenting data in time trends, Zebra BI Charts enables users to extend AC values with FC values for the remaining period when the Actual values end at a certain point. This approach assists the viewer in getting a more complete and comprehensive understanding of the data and making informed decisions based on the combined actual and forecasted information.
Customizable Visual Themes: With Zebra BI, you can personalize your charts' aesthetic to align with your company's branding or style. You can create and apply custom visual themes, adjusting everything from the color palette to the font style.
Interactive Dashboards: Zebra BI empowers you to create dynamic, interactive dashboards, allowing your audience to engage with your data more meaningfully. Users can drill down into data, change views, and interact with charts directly to explore the information at their own pace.
Smart Scaling and Zooming: Sometimes, data points in a bar chart can differ in scale, making it challenging to visualize smaller values. Zebra BI's innovative scaling feature solves this by adjusting the scale for maximum readability. Furthermore, with the zoom feature, you can focus on specific parts of your chart, revealing hidden insights.
Commenting and Collaboration Tools: Data analysis requires collaboration. Zebra BI provides features for commenting and sharing charts, fostering collaborative analysis and decision-making. It integrates seamlessly with PowerPoint and other reporting tools, enhancing team productivity.
Best Practice Templates: Zebra BI has a library of effective practice templates following International Business Communication Standards (IBCS). These templates provide a solid starting point, ensuring your charts are clear, concise, and compliant with international reporting standards.
Exploring the advanced features of Zebra BI can revolutionize your data visualization approach. Master these tools, and you'll be well-equipped to maximize your charting potential, leading to more insightful and impactful data storytelling.
Conclusion
Bar charts are fundamental tools in data visualization. They offer a clear and straightforward way to represent your data, making them essential for any data storyteller. Whether using Excel's native functionality or employing Zebra BI's enhanced features, mastering bar charts is crucial in your data visualization journey.
But remember, the tool is only as good as the craftsman. The secret to an effective bar chart is not just in how it's made but also in how it's used. Is your chart accurately representing your data? Is it telling the right story? Does your audience understand it easily? These questions should guide your design process.
Never underestimate the power of a well-crafted bar chart. It can help reveal trends, compare categories, and, most importantly, turn complex data into a narrative everyone in your organization can understand and act upon.
So keep honing your skills, learn, and don't stop experimenting. Data visualization is about telling a compelling story. Make every bar count!
Start creating better bar charts in Excel
Transform your data into powerful, actionable reports with just a few clicks with Zebra BI for Office!
Hi
Hello Rafeequ, thank you for checking out our Bar Chart Guide. How can we help you?