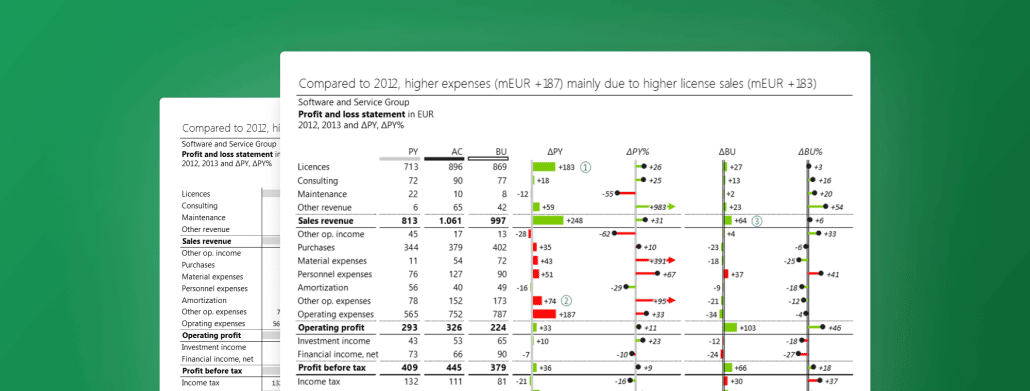
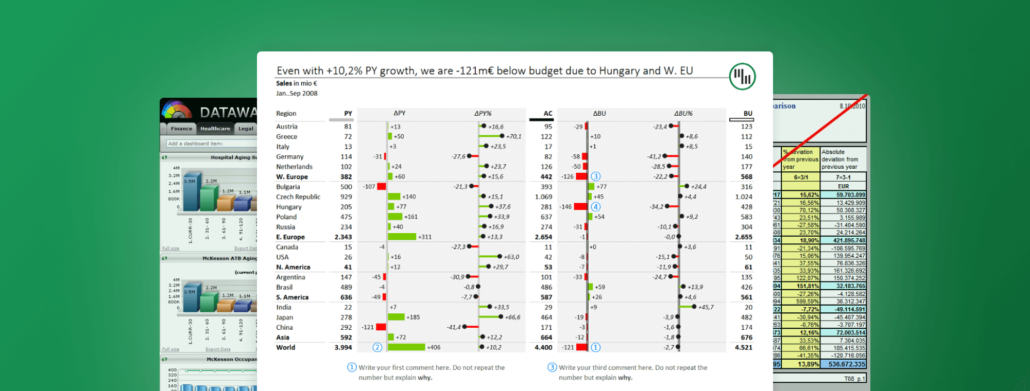
This Excel template explains the reasons behind the revenue growth and presents top contributors for each category with a bridge chart, dynamic comments, and automatic variances.
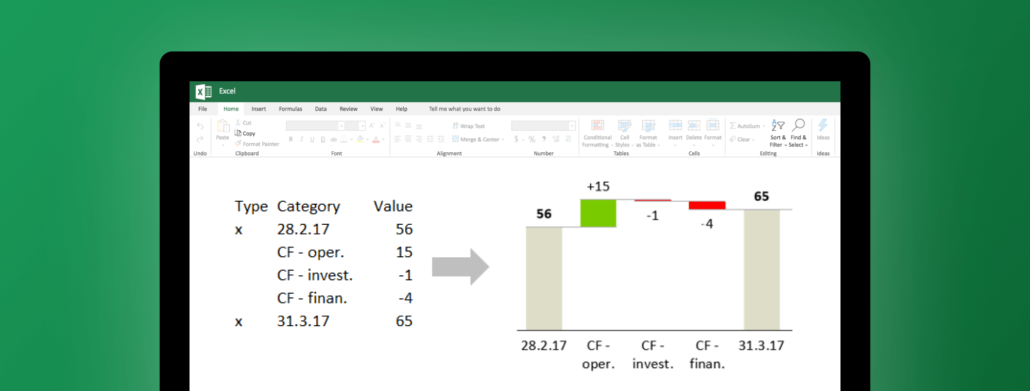
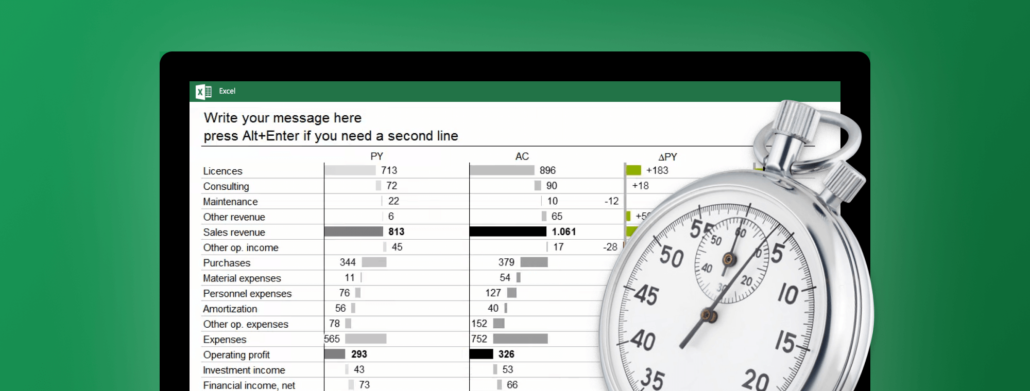
Visualize your P&L in Excel by comparing your actual value to the previous year using a table with integrated waterfall chart, custom calculations, automatically calculated variances, and more!
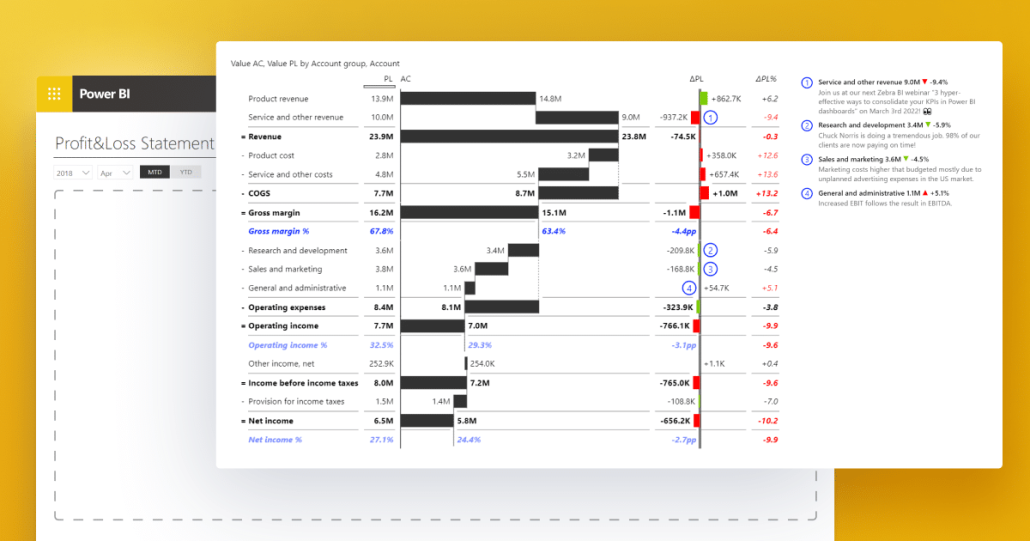
Learn how to create professional income statements in Power BI 4x faster. Complete guide with DAX formulas, templates, best practices, and automation solutions. Used by Coca-Cola, Abbott & 10,000+ finance teams.
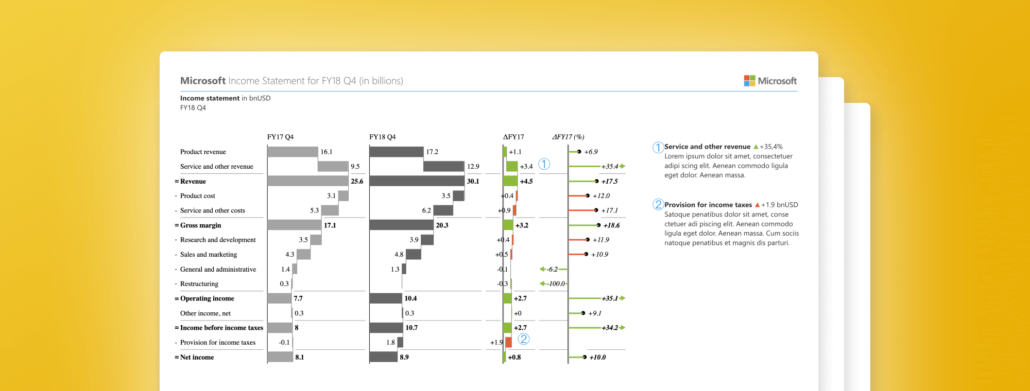
See an example of using Power BI capabilities with the advanced visualization capabilities of Zebra BI used for redesigning Microsoft's income statement.
If there is one report that's a business constant, it's the income (profit & loss) statement. Learn how to create an actionable income statement in Excel
 September 8th
 February 22nd