
Designing financial reports, dashboards and business presentations
How do your financial reports look? All too often, they fall somewhere between messy spreadsheets and dashboards, full of poorly labelled and inappropriate charts, that simply do not get the message across to the decision-makers.
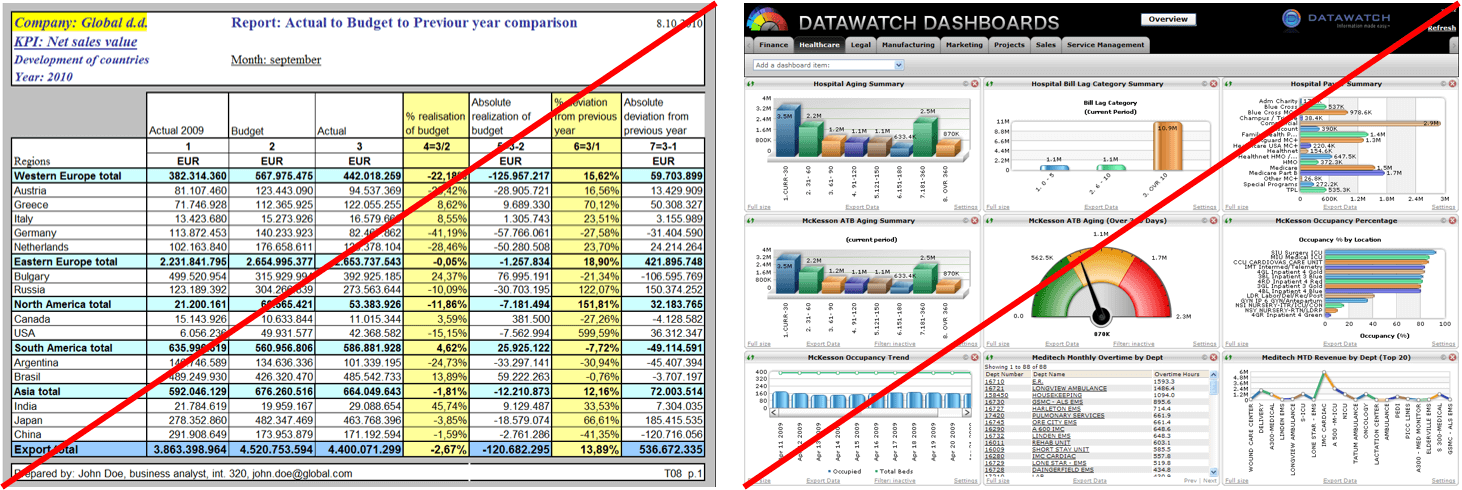
Countless reports and presentations are created throughout organizations on a daily basis, all in different formats, lengths, shapes and colors, depending on preferences of the person who prepares them. The end results are often managers not making their way through the data presented, time being wasted, and important decisions failing to be made.
The solution - International Business Communication Standards
In 2004 Dr Rolf Hichert, the renowned German professor, took on a challenge to standardize the way analysts and controllers present data in their reports, dashboards and presentations. His extremely successful work culminated in 2013 with the public release of the International Business Communication Standards (IBCS) the world’s first practical proposal for the standardized design of business communication.
The IBCS consistently define shapes and colors of actuals and budgets, variances, different KPIs, etc. Often referred to as the “traffic signs for management”, the IBCS is a set of best practices that went viral in Europe and have solved business communication problems in numerous companies such as SAP, Bayer, Lufthansa, Philips, Coca-Cola Bottlers, Swiss Post, etc.
How does it work?
Let’s take a look at a typical column chart, designed to help us compare actual sales figures vs. budget:
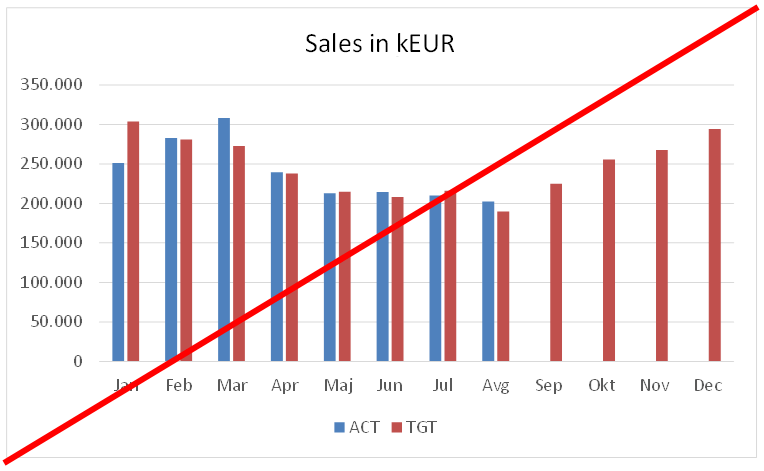
Is it efficient? The colors used are completely arbitrary, probably just an accidental default of the software tool. It is quite hard to estimate the variances to budget. Are we above the budget or below the budget in a particular month? For how much?
Now let’s observe the same dataset, designed according to the IBCS:
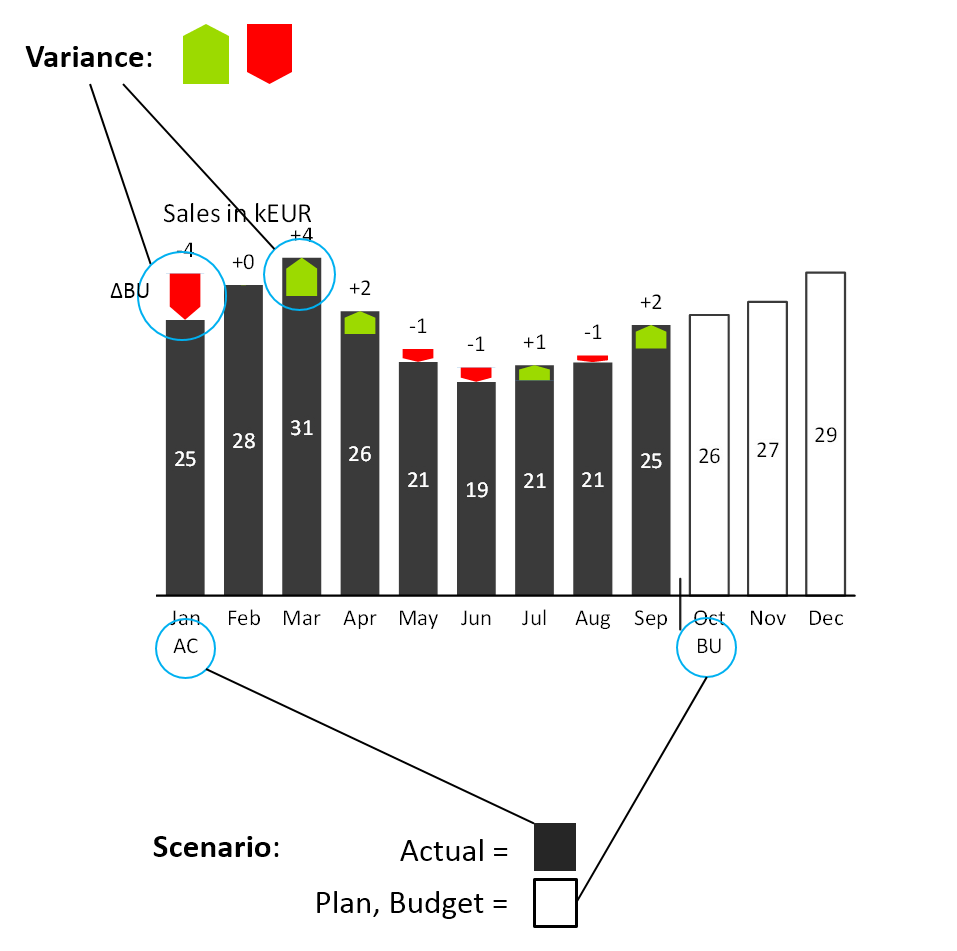
The actuals are depicted as dark grey full columns, while the budget is an outline. This is called scenario coding: the budget is an empty frame that has to be filled up with the actuals.
The variances are explicitly calculated and visualized. Positive variance is green, negative is red. The user’s attention is guided to the variances, which are in this case the key element to understand the sales performance.
The values are explicitly labelled at the most appropriate position on the chart. All texts are standardized, exact, short and displayed horizontally.
Storyline, visual design and uniform notation
The IBCS standards are not just about charts. They comprise an extensive set of rules and recommendations for the design of business communication that help:
- Organize and structure your content by using an appropriate storyline
- Present your content by using an appropriate visual design and
- Standardize the content by using a consistent, uniform notation.
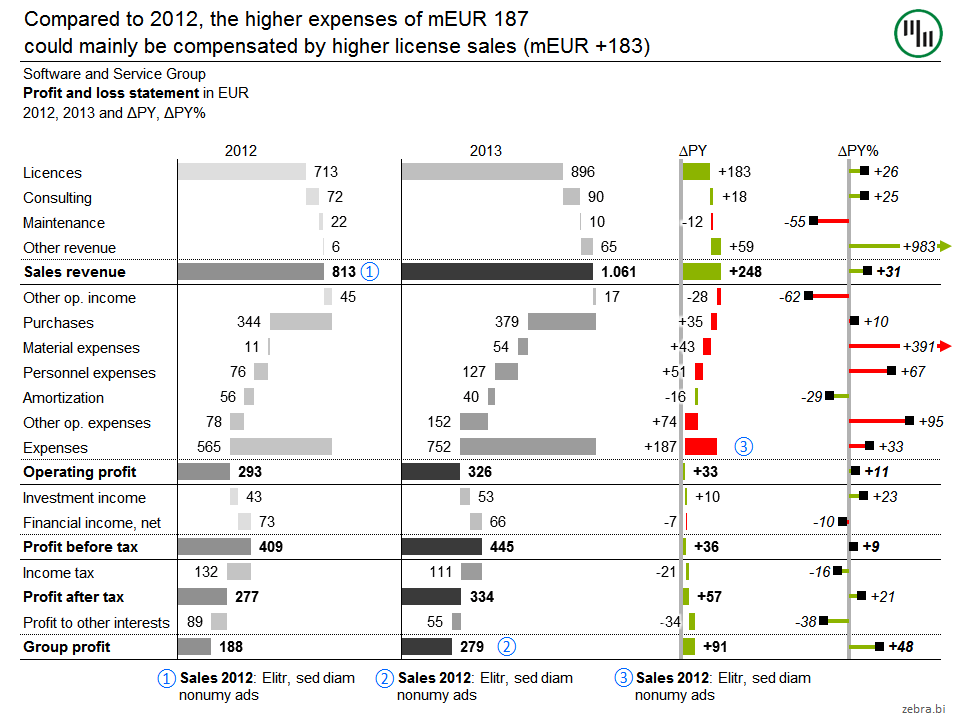
After you apply the IBCS rules to your standard variance report, it will look something like this:
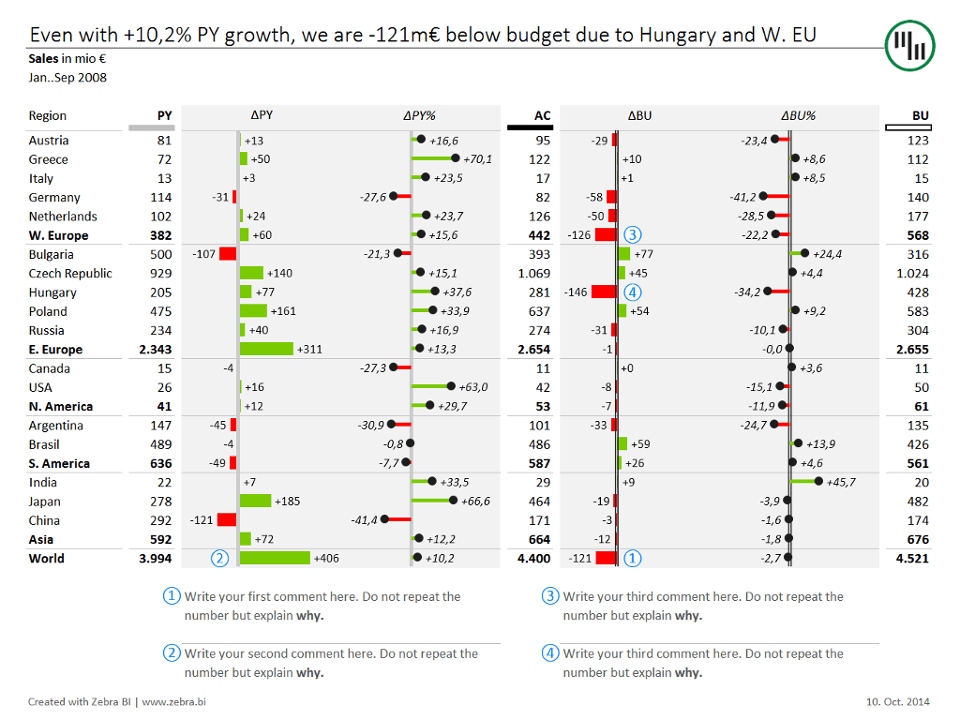
As you may have noticed, this report has several distinctive features:
- The key message (headline) at the top
- Title elements below the key message
- Clear structure of columns (first PY for previous year values, then AC for actual and at the end BU for budget; always in this order)
- Scenario markers below column headers (grey for PY, black for AC and outline for BU)
- Strictly no decorative elements, only a few horizontal lines
- Variances are visualized with red/green “plus-minus” charts and embedded into the table
- Absolute variances (ΔPY, ΔBU) are visualized as a bar chart, while relative variances (ΔPY%, ΔBU%) are visualized as “pin” charts (we prefer to call them “lollipop” charts)
- Semantic axis in charts: grey axis for variance to PY (grey = previous year), double line for variance to budget (outline = budget)
- Numbered explanatory comments that are integrated into the report.
A clear message, appropriate data visualization and accurate explanations. The story that numbers are telling is presented on one single page. That's what the managers expect.
We'll introduce the IBCS standards to the US public between Oct 19 and Nov 4. Visit us at the following events:
Oct 22, 2015 - Lecture at Data Visualization NY Meetup, McKinsey
27th Oct, 2015 - Full day IBCS workshop in New York
29th Oct, 2015 - FREE half-day seminar in Washington, DC
Andrej Lapajne is the CEO at Zebra BI, the IBCS certified reporting tool for Excel, and founding member at the IBCS Association