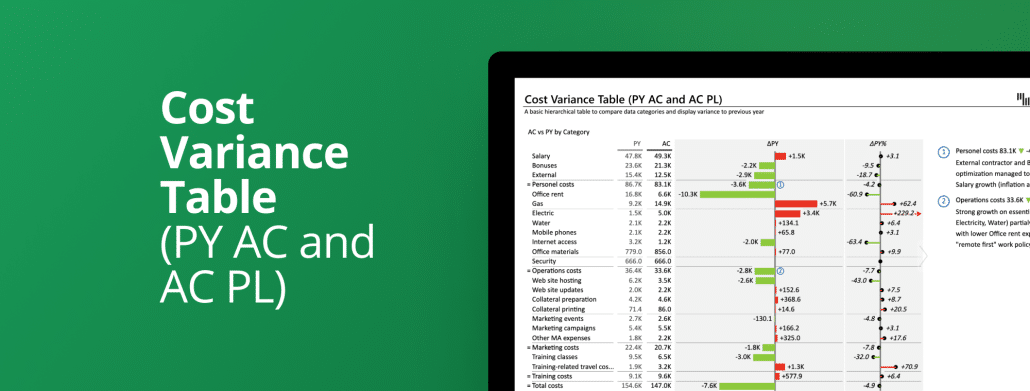
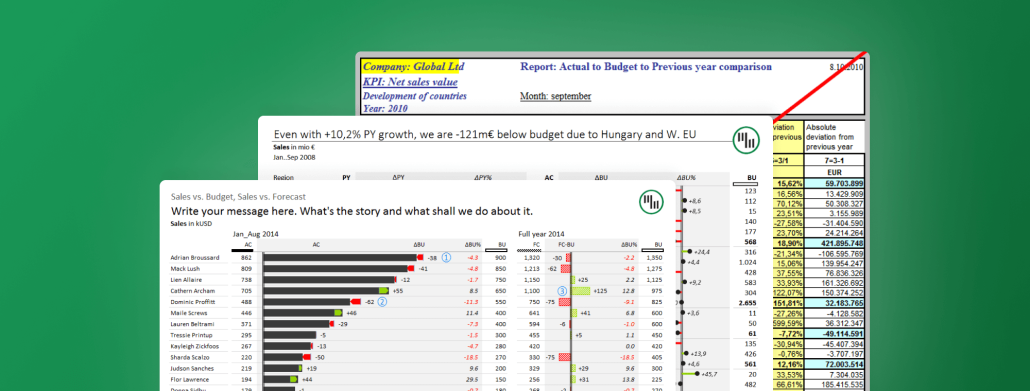
The most powerful template for checking the Market/Country's actual performance in a hierarchical table. You can add up to 3 comparisons at the same time (plan, previous year, and forecast) with automatically calculated variances and integrated dynamic comments.
Check the Market/Country's actual performance in a hierarchical table by adding 2 comparisons at the same time (plan and previous year). Zebra BI automatically calculates the variances and lets you add dynamic comments for more context.
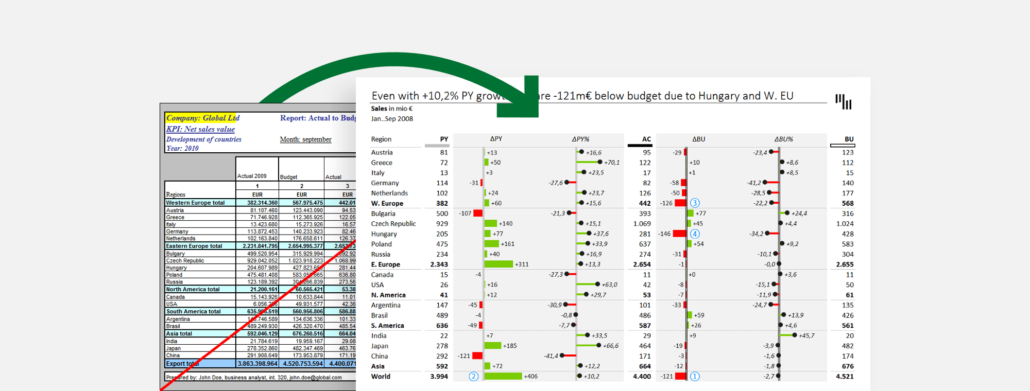
This template shows Market/Country performance in a hierarchical table. It is a simple comparison of two measures (actual and plan or actual and previous year) with automatically calculated variances and integrated dynamic comments.
The internet is full of bad examples of variance reports. Follow this guide to see how we turn one such example into a great and efficient variance report.
 September 8th
 February 22nd