Products
Why Zebra BI?
Product Tour
Zebra BI for Power BI
Zebra BI for Office
Zebra AI
NEW
Zebra BI Live Demo
July 23, 2025
Resources
GETTING STARTED
How to start with Zebra BI?
Zebra BI Academy
RESOURCES
Resource Hub
Templates
Webinars
Guides
Customer Stories
HELP
Knowledge Base
Product updates
Contact support
Customers
Pricing
Search for:
Login
Try Zebra BI for free
Try For Free
Products
Why Zebra BI?
Product Tour
Zebra BI for Power BI
Zebra BI for Office
Zebra AI
NEW
Zebra BI live demo
July 23, 2025
Customers
Pricing
Resources
How to start with Zebra BI?
Zebra BI Academy
Resource Hub
Templates
Webinars
Guides
Customer Stories
Help
Help Center
Knowledge Base
Beginner's Guide
101 Crash Course
Chart Selector
Product updates
Contact support
Why Zebra BI
Our customers
Actionable reporting
Supercharge your Power BI
Calculate return on investment
Log In
Close
Upcoming webinar:
How to make your Power BI reports run up to 10x faster
September 8th
Register
Zebra BI Live Product Demo:
Start creating truly insightful Power BI reports and dashboards
February 22nd
Save the spot
Live webinar ➡️
Future-Proof Financial Reporting: Automate, Standardize, and Scale with Power BI
10 Jul 2025
Save the spot
Home
Resources
Category:
Webinar
Category:
Webinar
Excel
Webinar
October 26, 2016
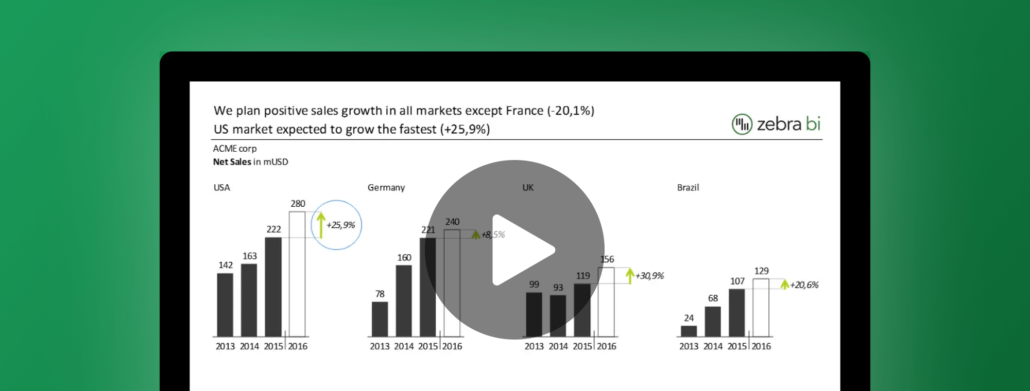
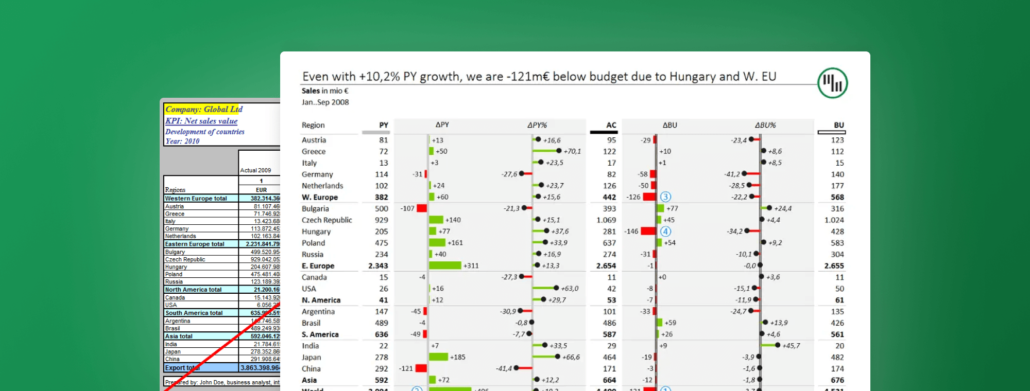
Practical Rules for Visualizing Budgets, Plans and Forecasts in Excel
The typical way to present budgets is with plain tables. Find out how to follow a much better approach by using some visualizations!
Watch now
Excel
Webinar
September 6, 2016
Improve your Excel reports with visual highlights
The ideal tool for bringing clarity to your reports and showcasing key information faster are visual highlights. Learn how this can be done easily with Zebra BI!
Watch now
Excel
Webinar
June 29, 2016
Automating Excel reports with PivotTables and slicers
MS Excel offers PivotTables, slicers and other functions that let you automate your reports and dashboards in an extremely efficient way. Learn how!
Watch now
Excel
Webinar
June 15, 2016
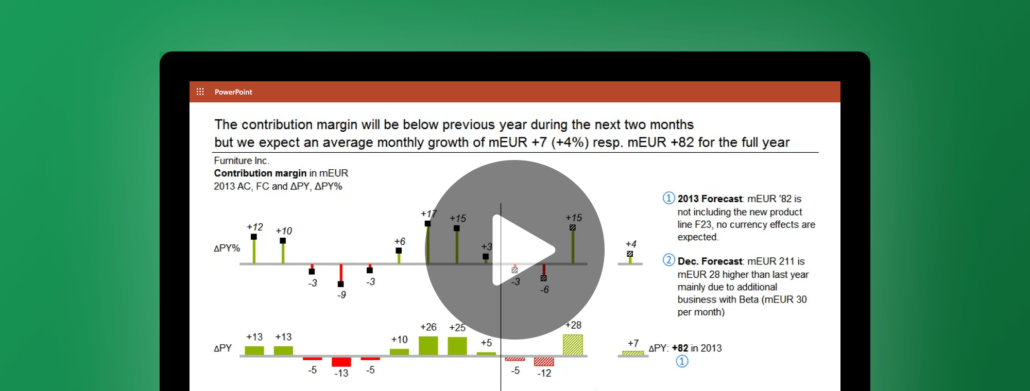
Creating updatable PowerPoint presentations
Learn how to export your tables, charts or even whole reports from Excel to PowerPoint and make them update automatically.
Watch now
Excel
Webinar
May 11, 2016
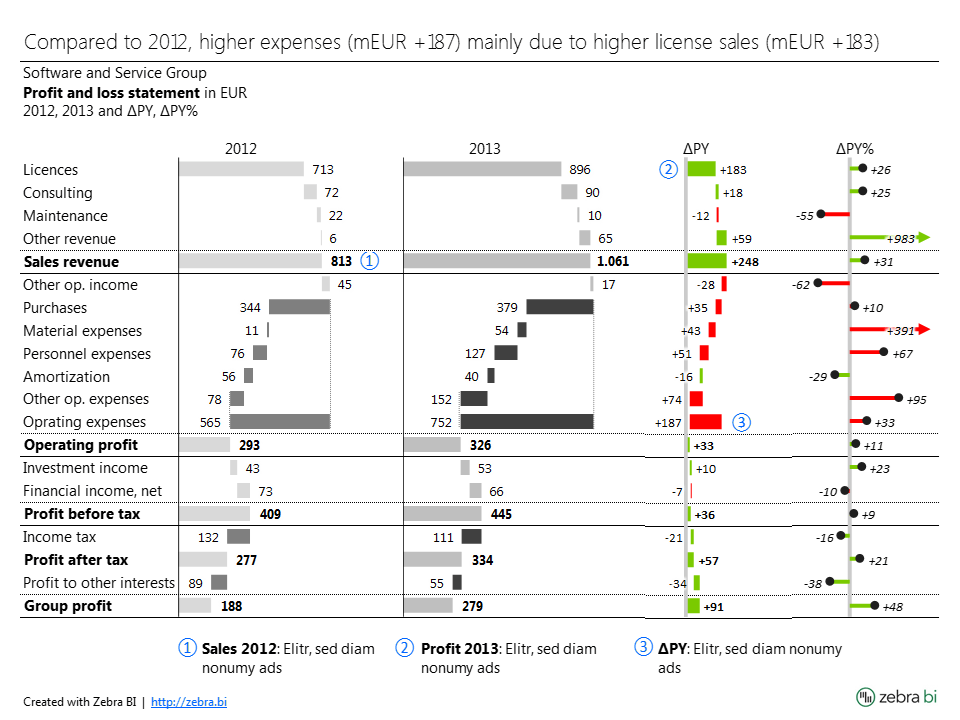
How to Design Income Statements (Profit & Loss Statements) in Excel
In need of some guidance on how to redesign the income statements to make them actionable, understandable and compliant with IBCS standards?
Watch now
Excel
Webinar
April 20, 2016
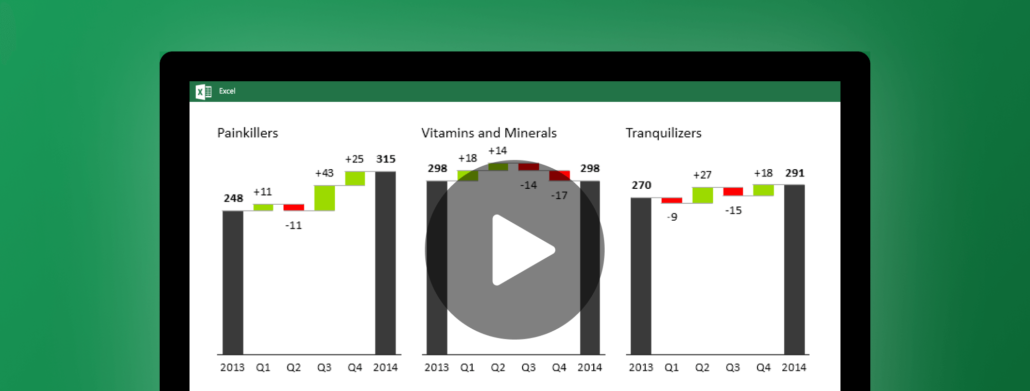
The Definitive Guide to Waterfall Charts
Waterfall charts are one of the most powerful tools of every business analyst. Get all the knowledge about them and some ideas for future reports!
Watch now
Excel
Webinar
April 5, 2016
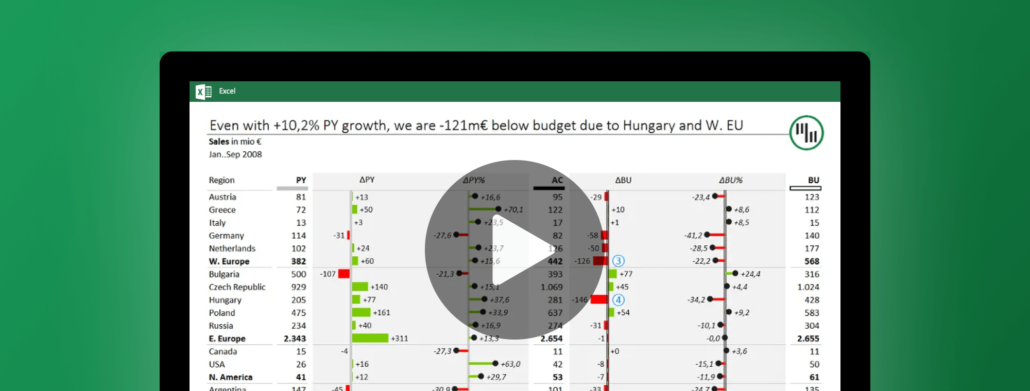
How to Create Efficient Variance Reports
Learn how to design efficient variance reports to track the actual performance against your company goals with the help of Zebra BI.
Watch now
Excel
Webinar
March 22, 2016
Getting Started with Zebra BI for Excel
Zebra BI is the perfect Excel add-in to help you effectively visualize and standardize your data. Take your chart types to the next level!
Watch now
Excel
Webinar
April 14, 2015
Data visualization in depth
Most reports and dashboards fail because of inappropriate or bad visualization. Check which efficient methods of data visualization to use.
Watch now
Product
Zebra BI for Power BI
Zebra BI for Office
Zebra AI
Latest Releases
Changelog
Pricing
Resources
Webinars
Templates
Guides
Customer Stories
Zebra BI Academy
Blog
Community Events
Legal documentation
Help
On-demand product tour
Live product demo
Knowledge base
Beginner’s Guide
Zebra BI 101 Crash Course
Chart Selector
Company
About
Careers
Customers
Become an Affiliate
Partner Program
Terms of Website Use
Contact Sales
Technical Support
© 2021 – 2025 Copyright Zebra BI d.d. All rights reserved. Various trademarks held by their respective owners.
Privacy Policy
Cookie Declaration
angle-up
angle-down
youtube-play
question-circle-o
dropdown-down
TimelineArrow
arrow
facebook
ln
logo-black
menu
no
search
twitter
 September 8th
 February 22nd
 10 Jul 2025