Get a quick overview and learn how to create even the most complex dashboards with a straightforward, extremely fast, and enjoyable experience.
Zebra BI Charts
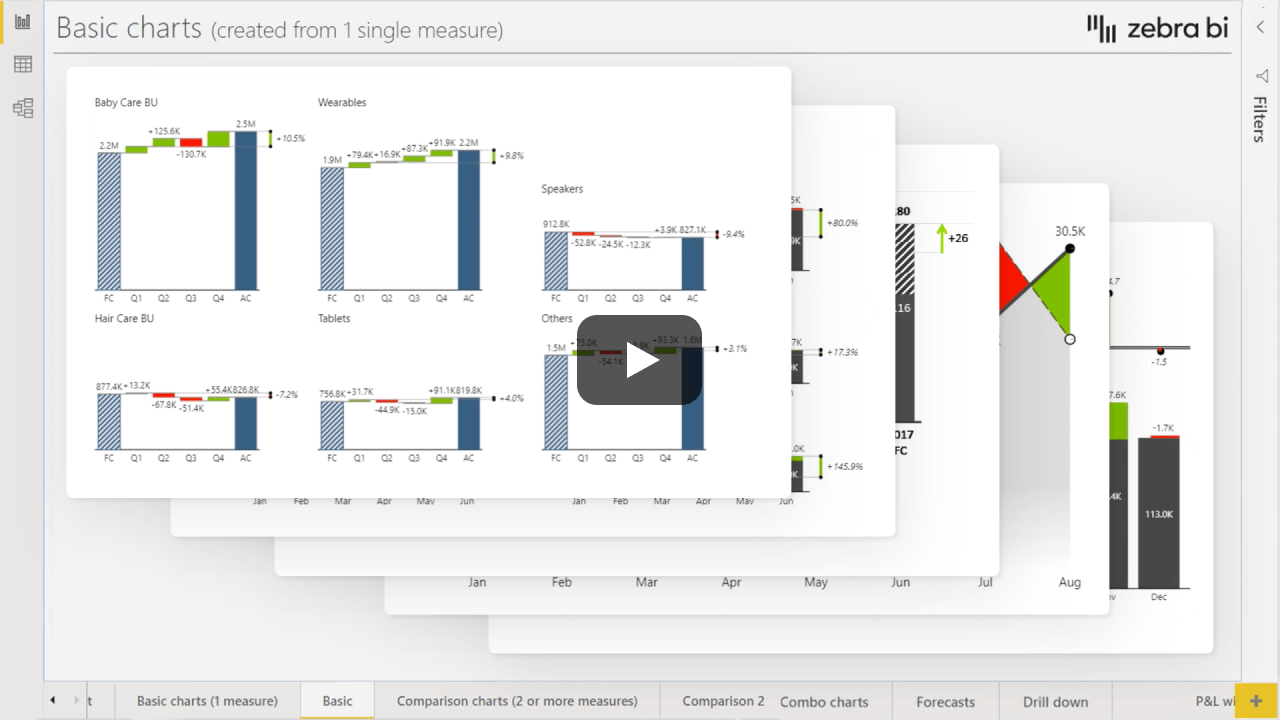
Zebra BI Charts features charts with a horizontal axis, such as column charts, line charts, waterfall charts, variance charts, 'hills&valleys', and many other types of advanced charts. You can easily create single or combination (combo) charts and above all, create powerful small multiples of any chart type.
This Power BI visual is therefore useful for visualizing time-related data (years, quarters, months, days, ...) and will automatically calculate PY, plan or forecast variances, and YoY growth rates.
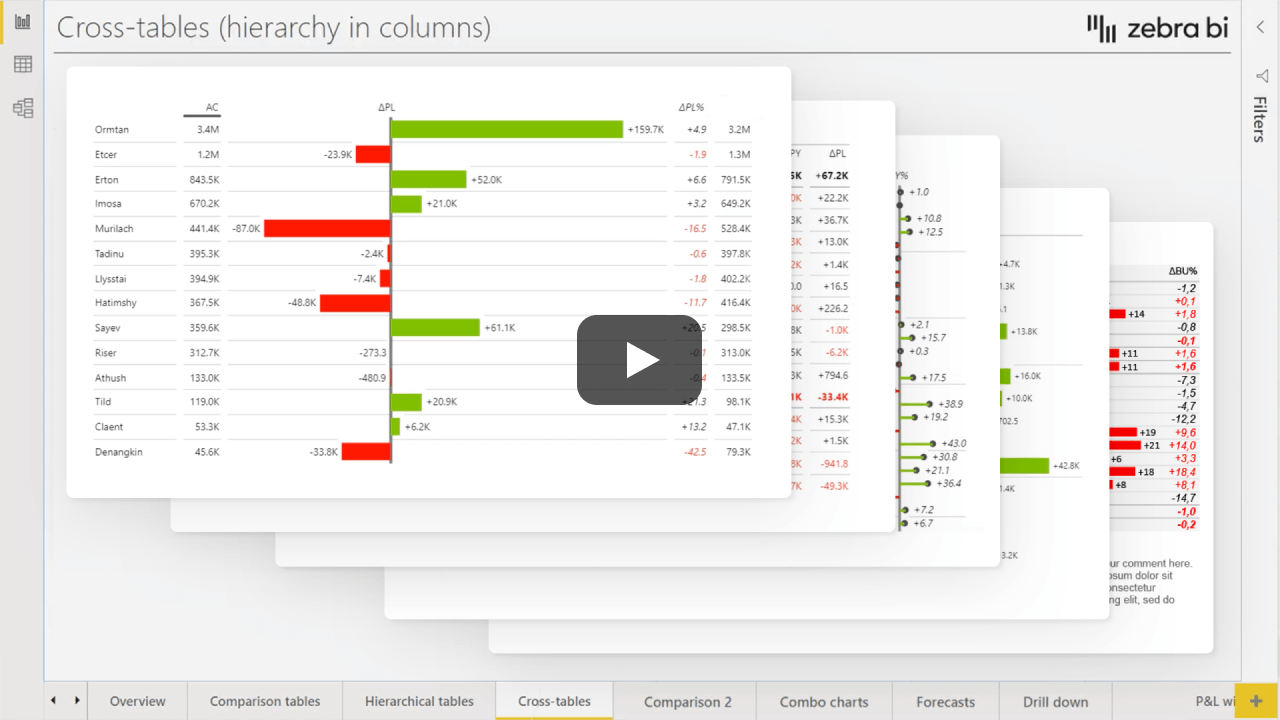
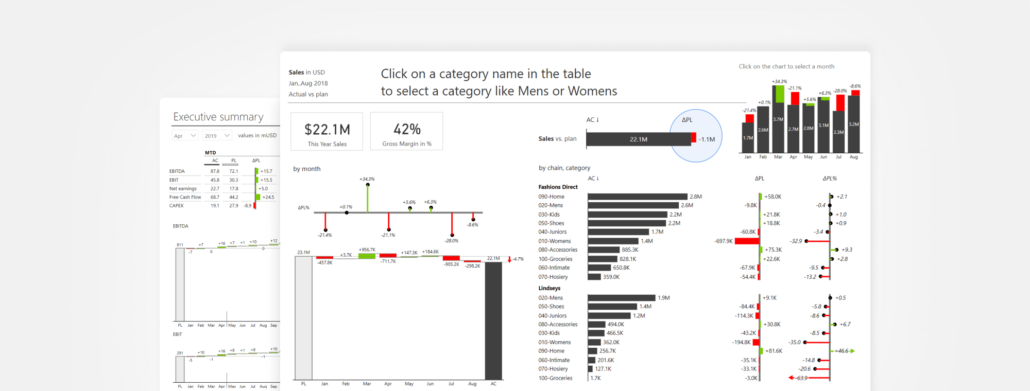
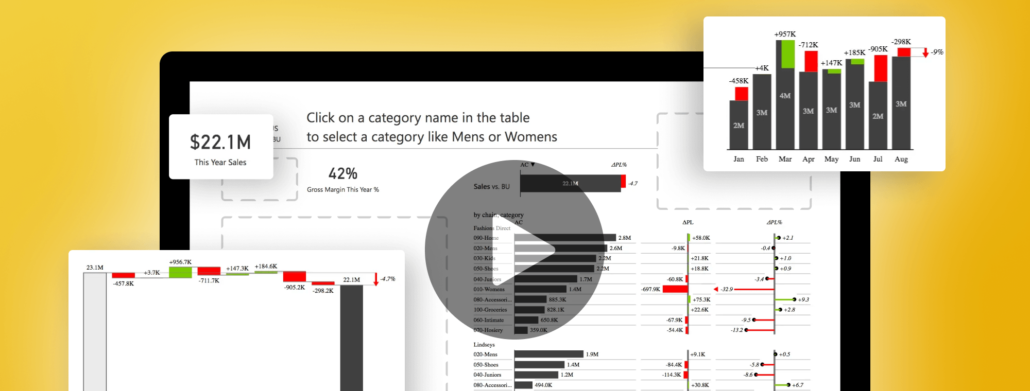
Zebra BI Tables is the most powerful table/matrix visual in Power BI and features charts with a vertical axis and various table-chart combinations. These charts are used for visualizing structure data such as products, customers, regions, accounts, business units or cost centers.
With Zebra BI Tables you can create spectacular sales dashboards, income statements (P&L), cost vs. budget, and s other business reports in Power BI with a few simple clicks.
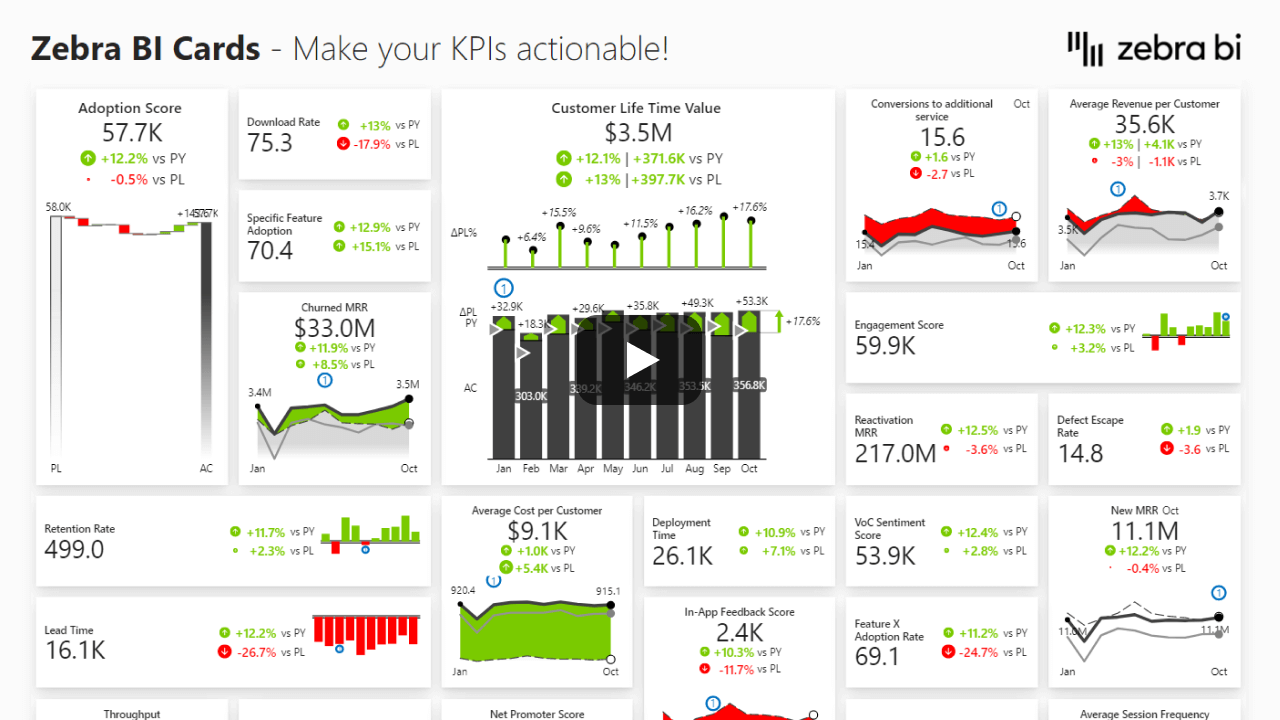
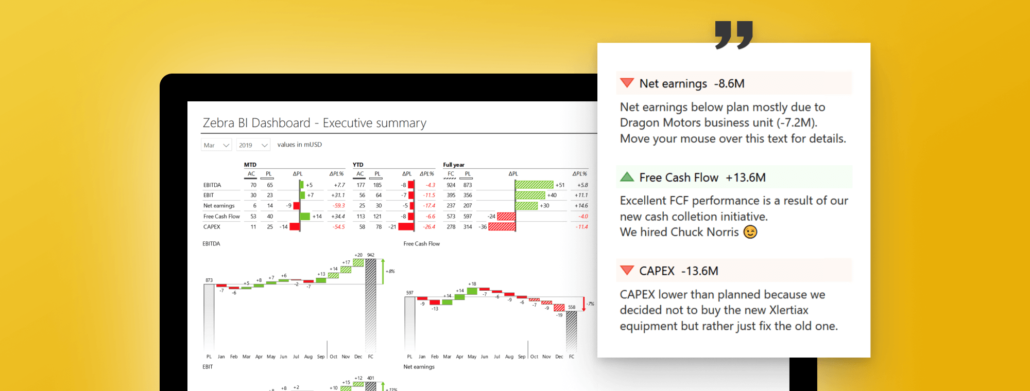
Zebra BI Cards visual enables you to present a complete overview of the most important KPIs in one click. It is an indispensable visual for any report entry page because it explains the whole context behind the data thanks to advanced functionalities like dynamic comments, drill-through, scaled groups, and more! Add as many KPIs as you wish in just one visual and make your reports blazingly fast by significantly decreasing the loading and rendering time.
Combining Zebra BI Cards with Zebra BI Charts and Tables, you will get a complete toolkit for actionable reports and dashboards in Power BI. Tell your company's story by showing top-level data and a more detailed explanation of numbers all in one page.
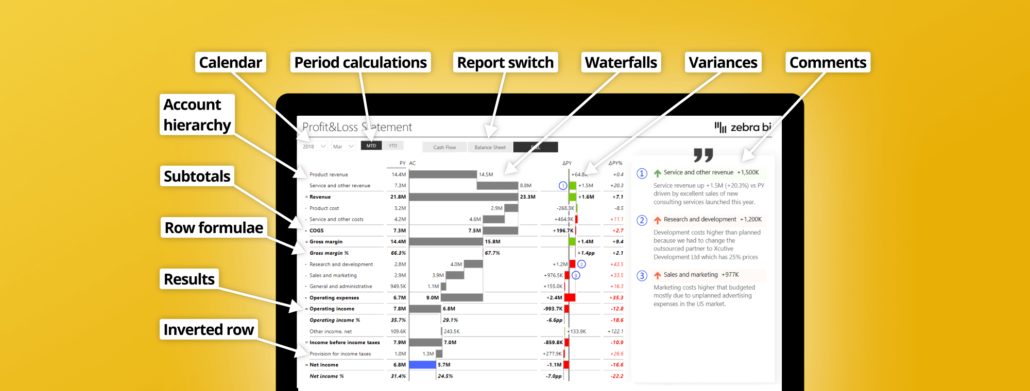
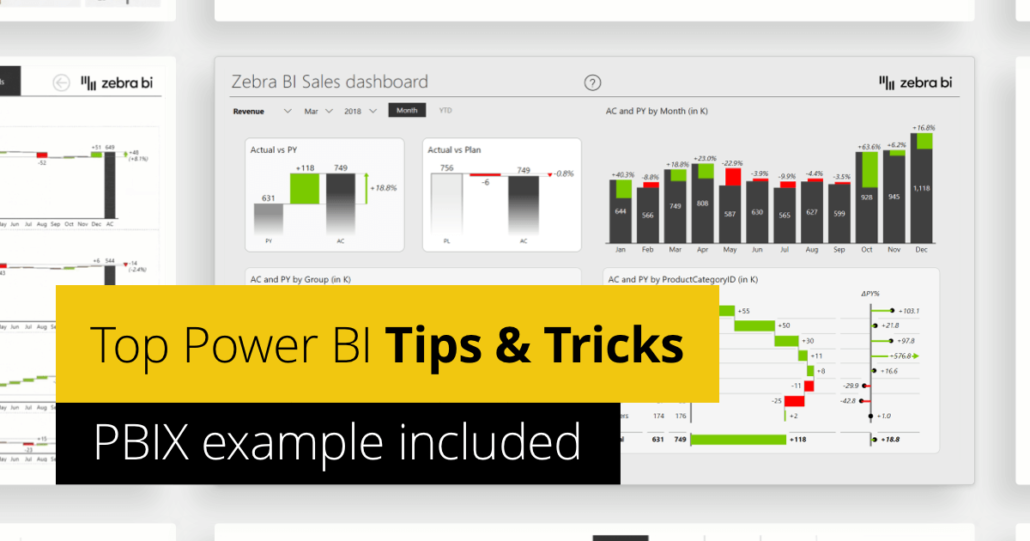
There are a lot of advanced Power BI reporting techniques to take your reports to the next level. Learn practical tips & tricks and implement them in real life.
With so many possibilities in Power BI to make nice dashboards also come many challenges. Learn the top most effective tips to create them more actionable.
Learn a powerful method for building advanced Power BI dashboards which are compatible with different platforms, fully responsive and easily shareable.
 September 8th
 February 22nd