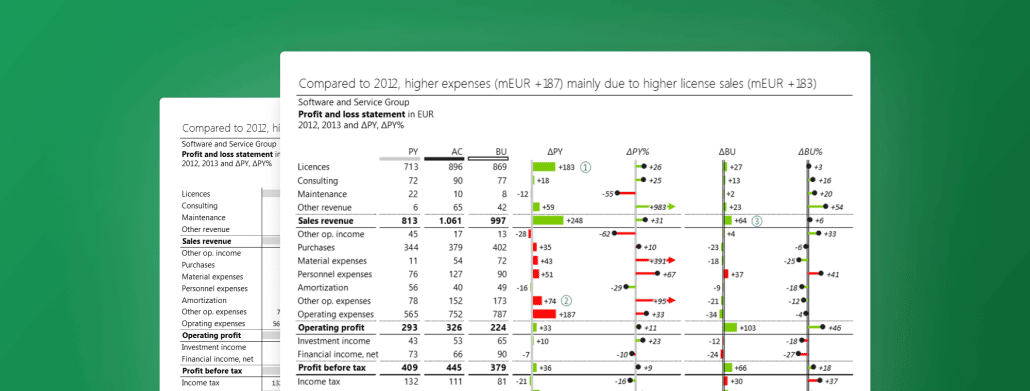
If there is one report that's a business constant, it's the income (profit & loss) statement. Learn how to create an actionable income statement in Excel
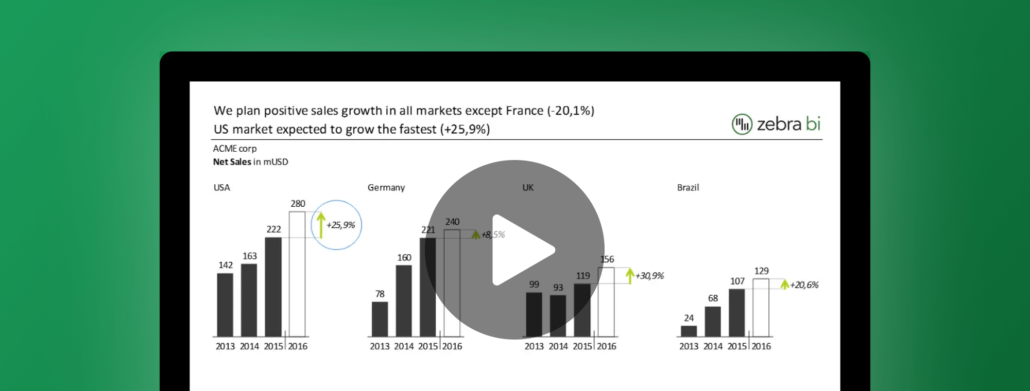
Discover the Excel report templates that will transform the way you design your most important financial reports inspired by Coca-Cola, Bayer and others.
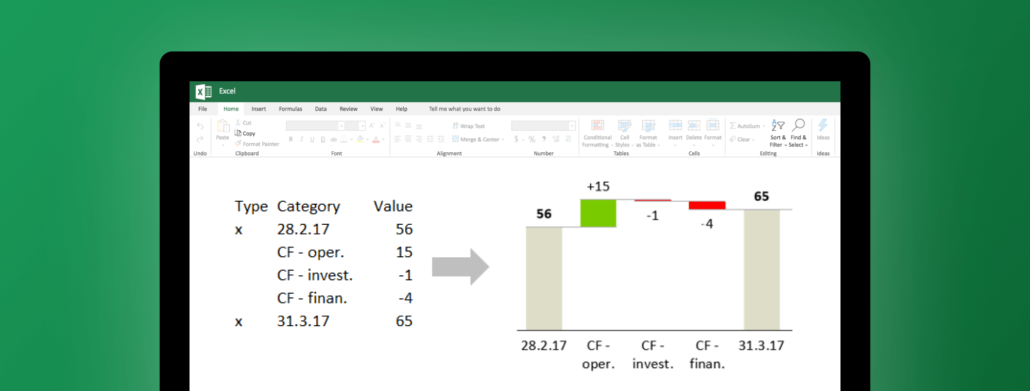
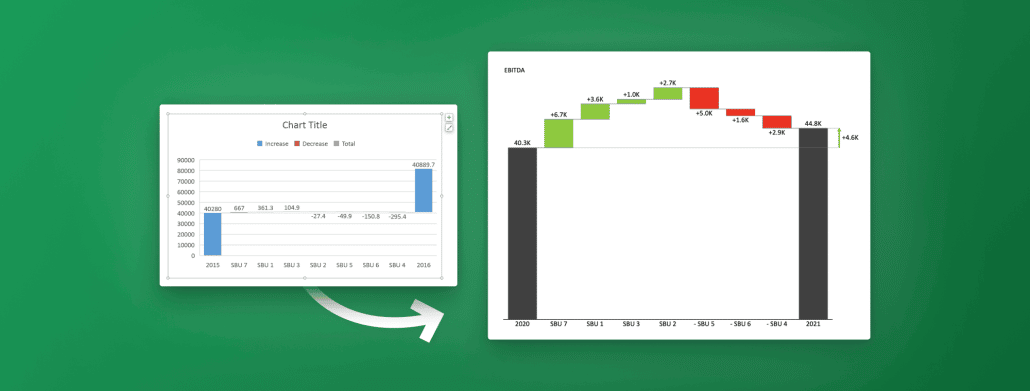
Learn how to create a visually appealing waterfall chart in Excel with our step-by-step guide. From beginners to experienced users, our guide provides all the necessary tips and tricks to impress your audience.
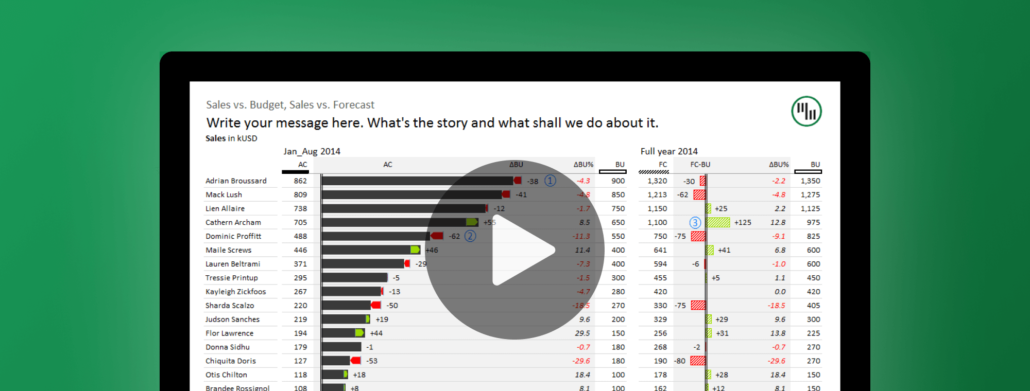
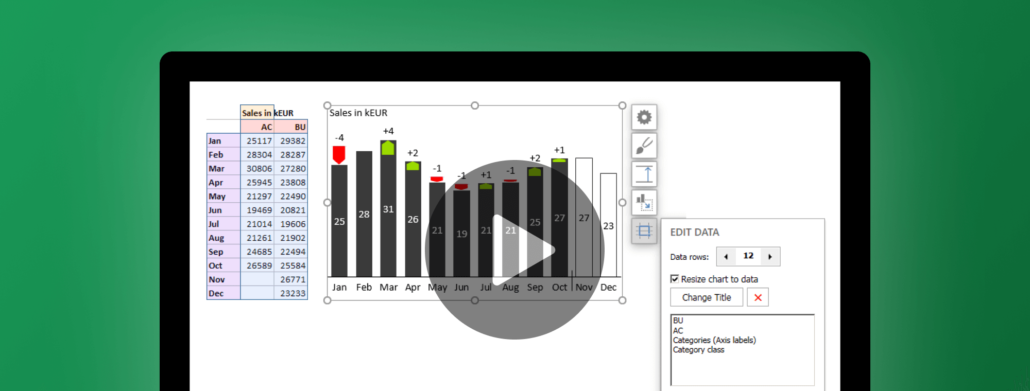
There are many ways of displaying variances. We will explain to you how to use basic and advanced visualization methods for tracking monthly variances.
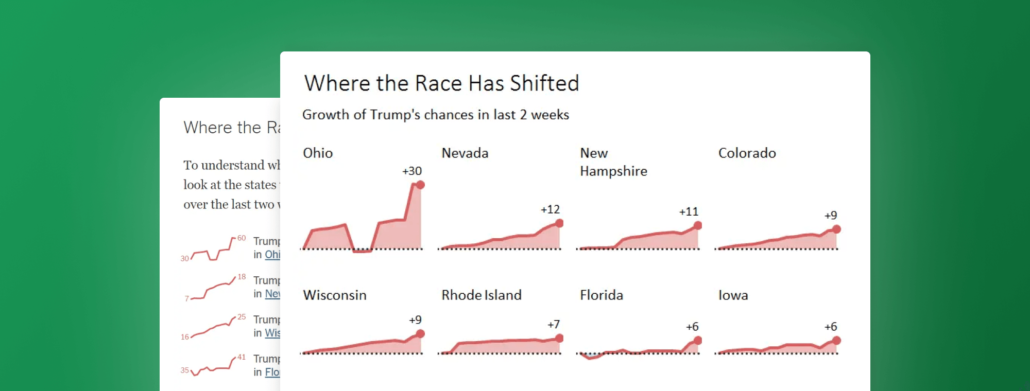
This visualization fails to convey a proper picture of the trends due to inconsistent scaling of charts. Learn 3 alternative solutions how to adress this problem.
 September 8th
 February 22nd
 26 Feb 2026