Small Multiples – 16 are better than one
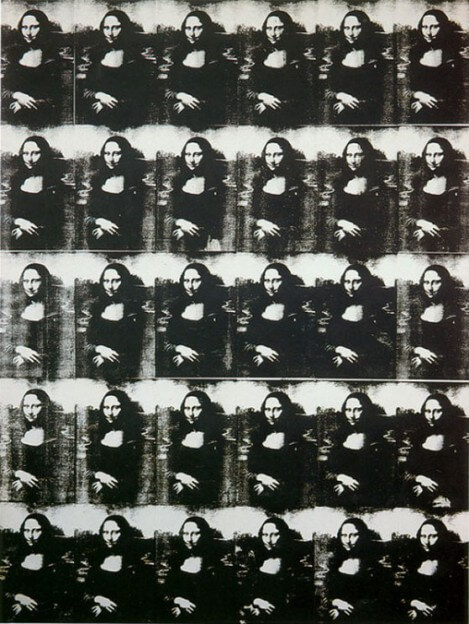
In his “serial art” Andy Warhol was using image repetition (multiplication) as a means to achieve the feeling of detachment and to play with the notions of originality, simulacra, etc. However, it is interesting that image multiplication is in fact one of the most effective methods for solving information design problems.
For a wide range of problems in data presentation, small multiples are the best design solution.
– E. Tufte, Envisioning Information (1990)
When discussing the value of high-information graphics in his work “The Visual Display of Quantitative Information” (1983), Edward Tufte named this method “Small multiples”. Small multiples are also called trellis chart, grid chart, panel chart, multipanel chart or lattice chart, while Jacques Bertin proposes a similar method called Reorderable Matrix in his incredible work Sémiologie Graphique from 1967 (English translation published in 1983 as Semiology of Graphics: diagrams, networks, maps).
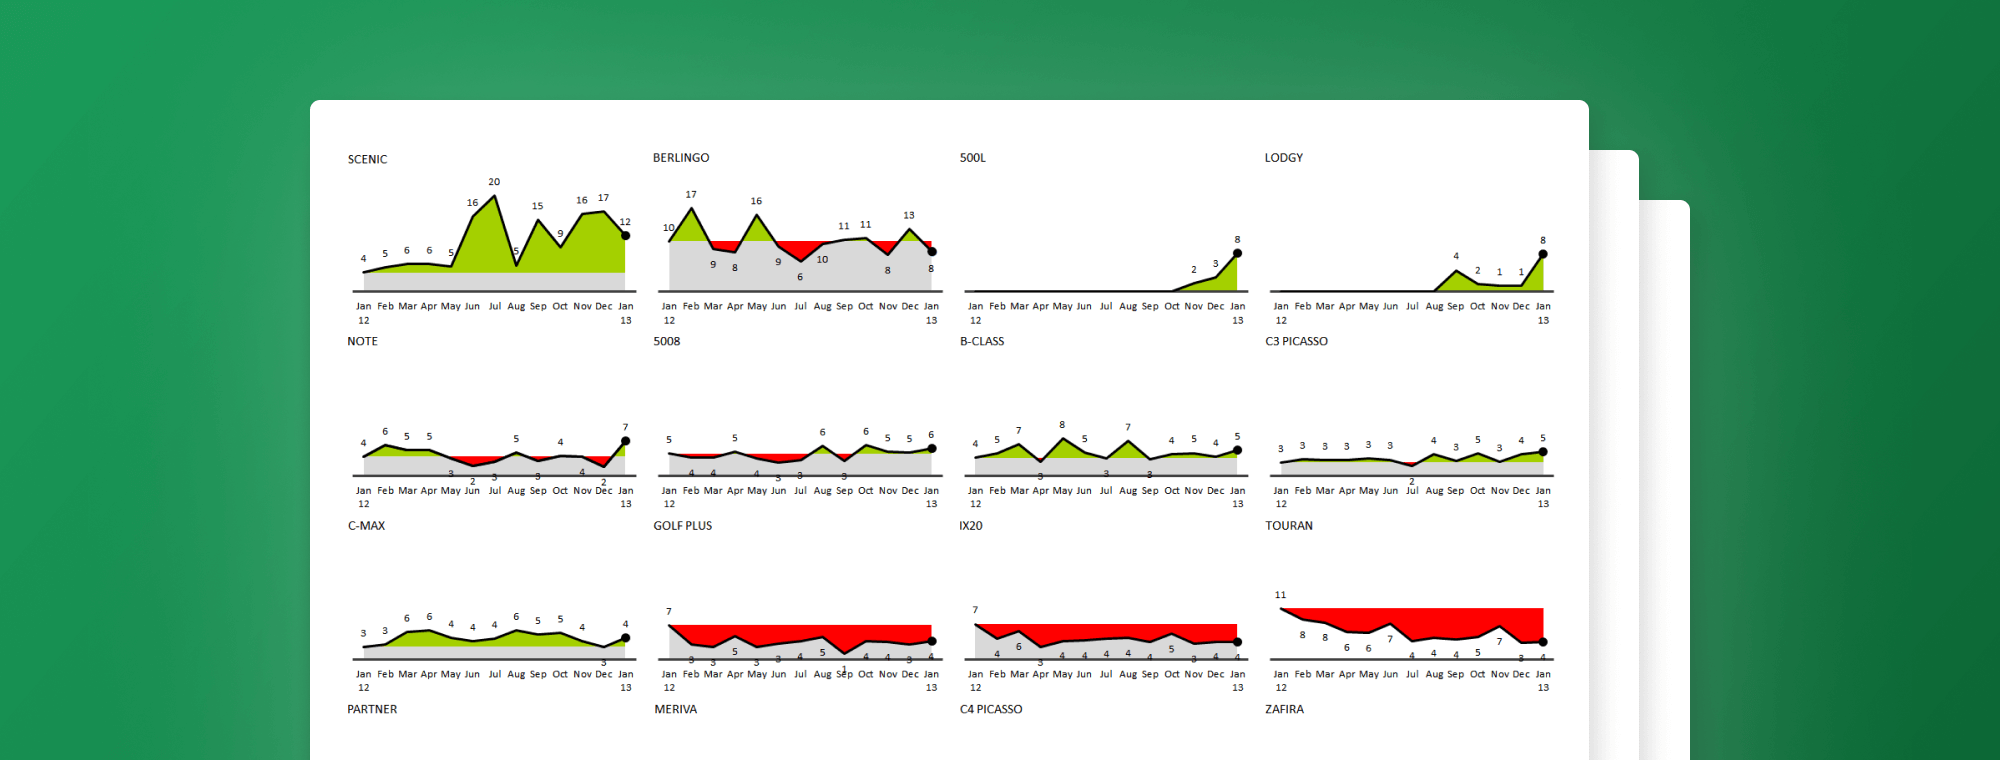
Let’s take a look at the following example, where the development of market shares is represented for the top 16 car models in a selected category of cars:
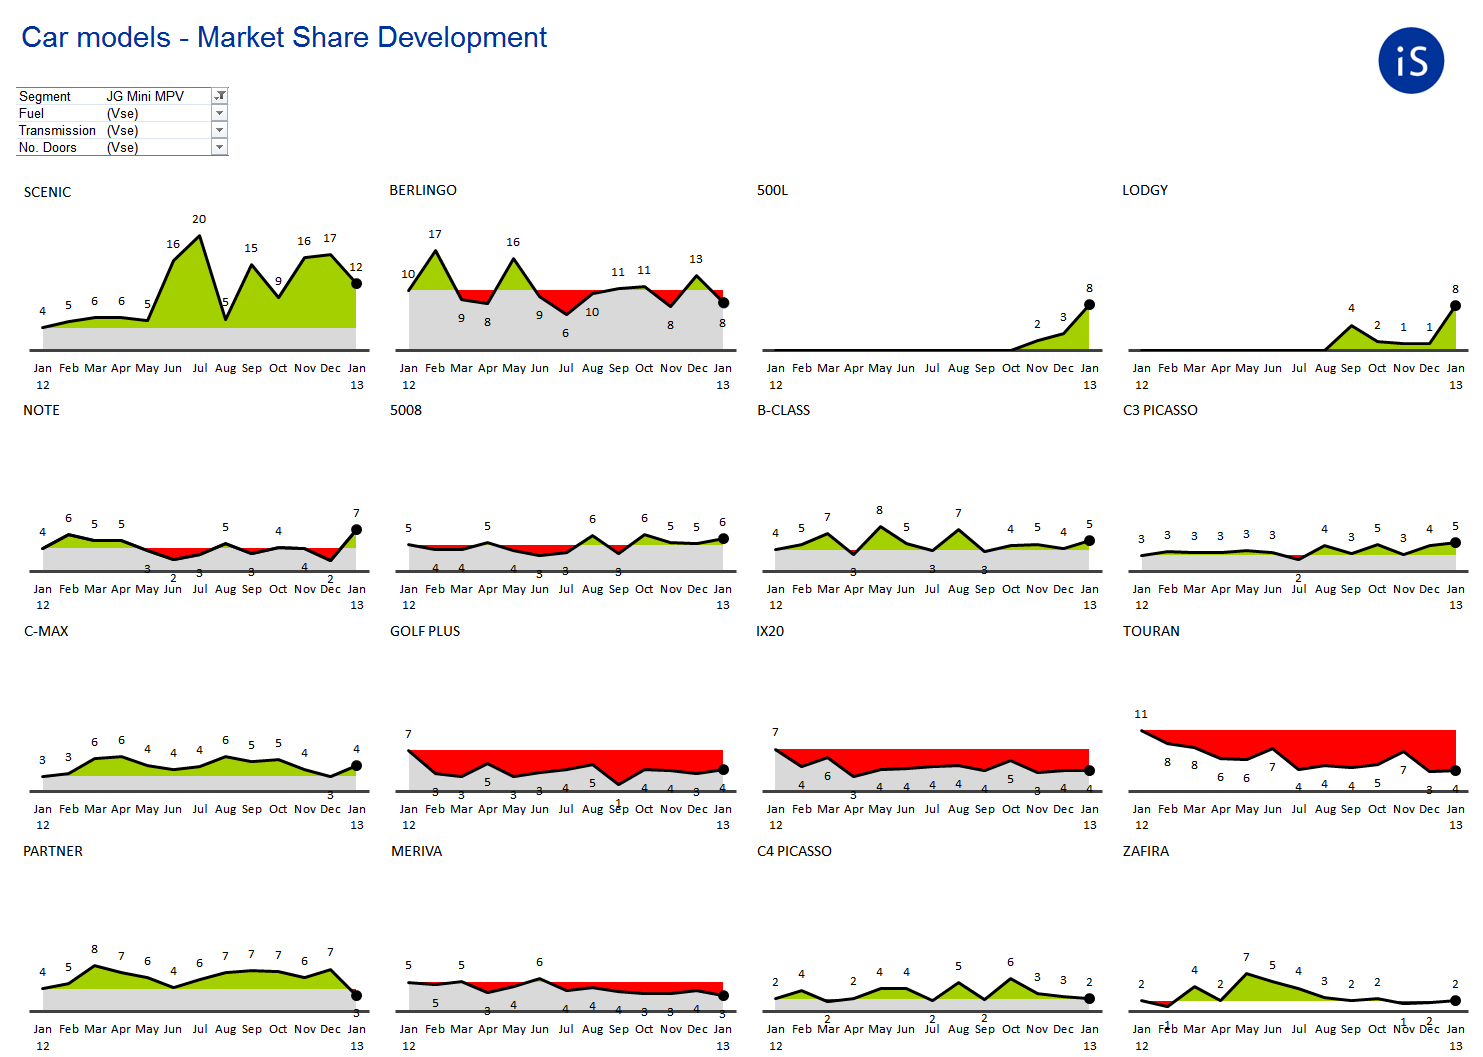
We decided to visualize the development of market shares as “Hills and Valleys” chart. The benchmark is the first value in the chart (January 2012) so that the user can easily see if subsequent values are above this benchmark (green “hills” symbolizing the growth of market share) or below them (“valleys” flooded with red color symbolizing the decline of market share). The small multiples construction of the whole report allows direct comparison of values since all charts are synchronized – depicted according to the same scale. All charts are sorted according to the last value (January 2012).
The development of a report like this requires a significant amount of time. But with Zebra BI we actually produced it from the source data in less than one minute.