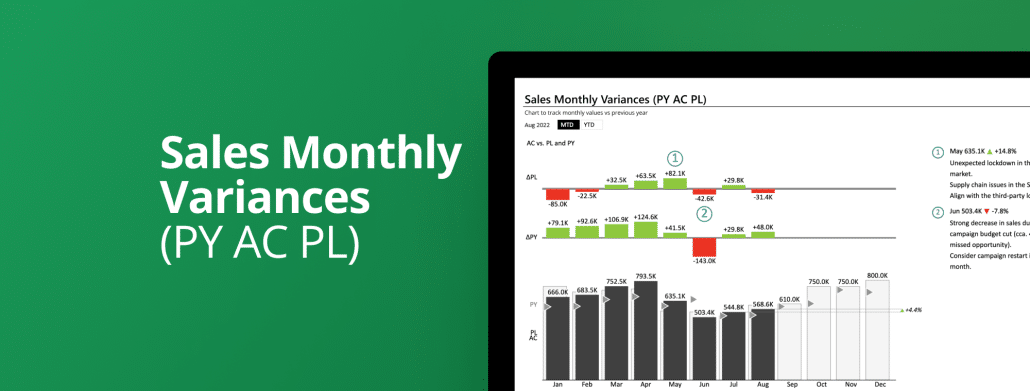
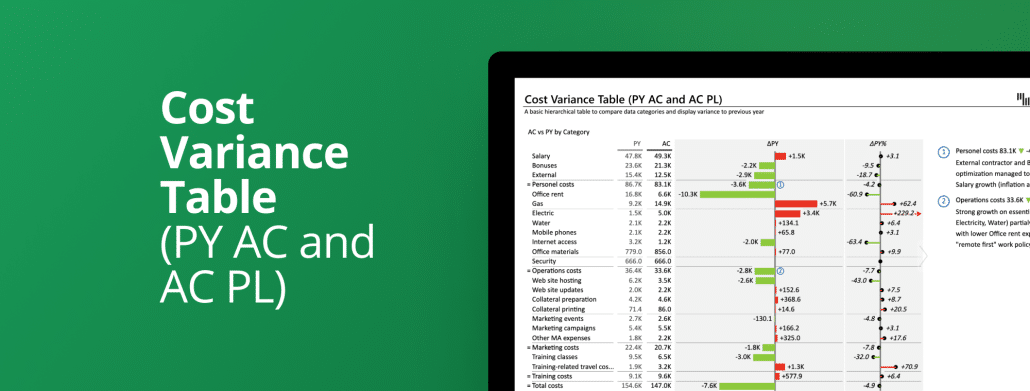
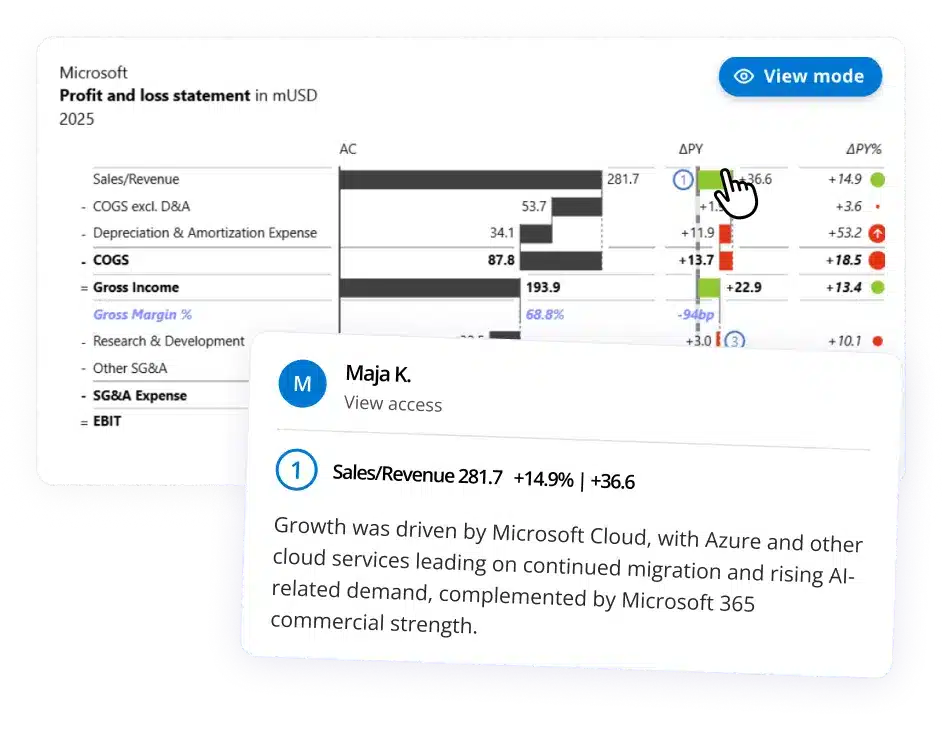
Check the Market/Country's actual performance in a hierarchical table by adding 2 comparisons at the same time (plan and previous year). Zebra BI automatically calculates the variances and lets you add dynamic comments for more context.
This template shows Market/Country performance in a hierarchical table. It is a simple comparison of two measures (actual and plan or actual and previous year) with automatically calculated variances and integrated dynamic comments.
 September 8th
 February 22nd
 27 Oct 2026