In this webinar, we'll talk about efficient methods of data visualization. If you wish to know more about the data ink theory and how to avoid the "lie factor", this is the right place for you.
What's included
Full video recording
Enjoy & thank you for watching! Don't hesitate to reach out if you have any questions — write to us at support@zebrabi.com!
Presenter
Andrej Lapajne
Founder & CEO at Zebra BI
Watch the Video
Share this
Ready to start uncovering actionable insights from your data?
Explore Zebra BI for Office and Power BI, or start a trial instantly and test our tools on your data. You can also contact us to help you build your first test report and create a custom package for your business.
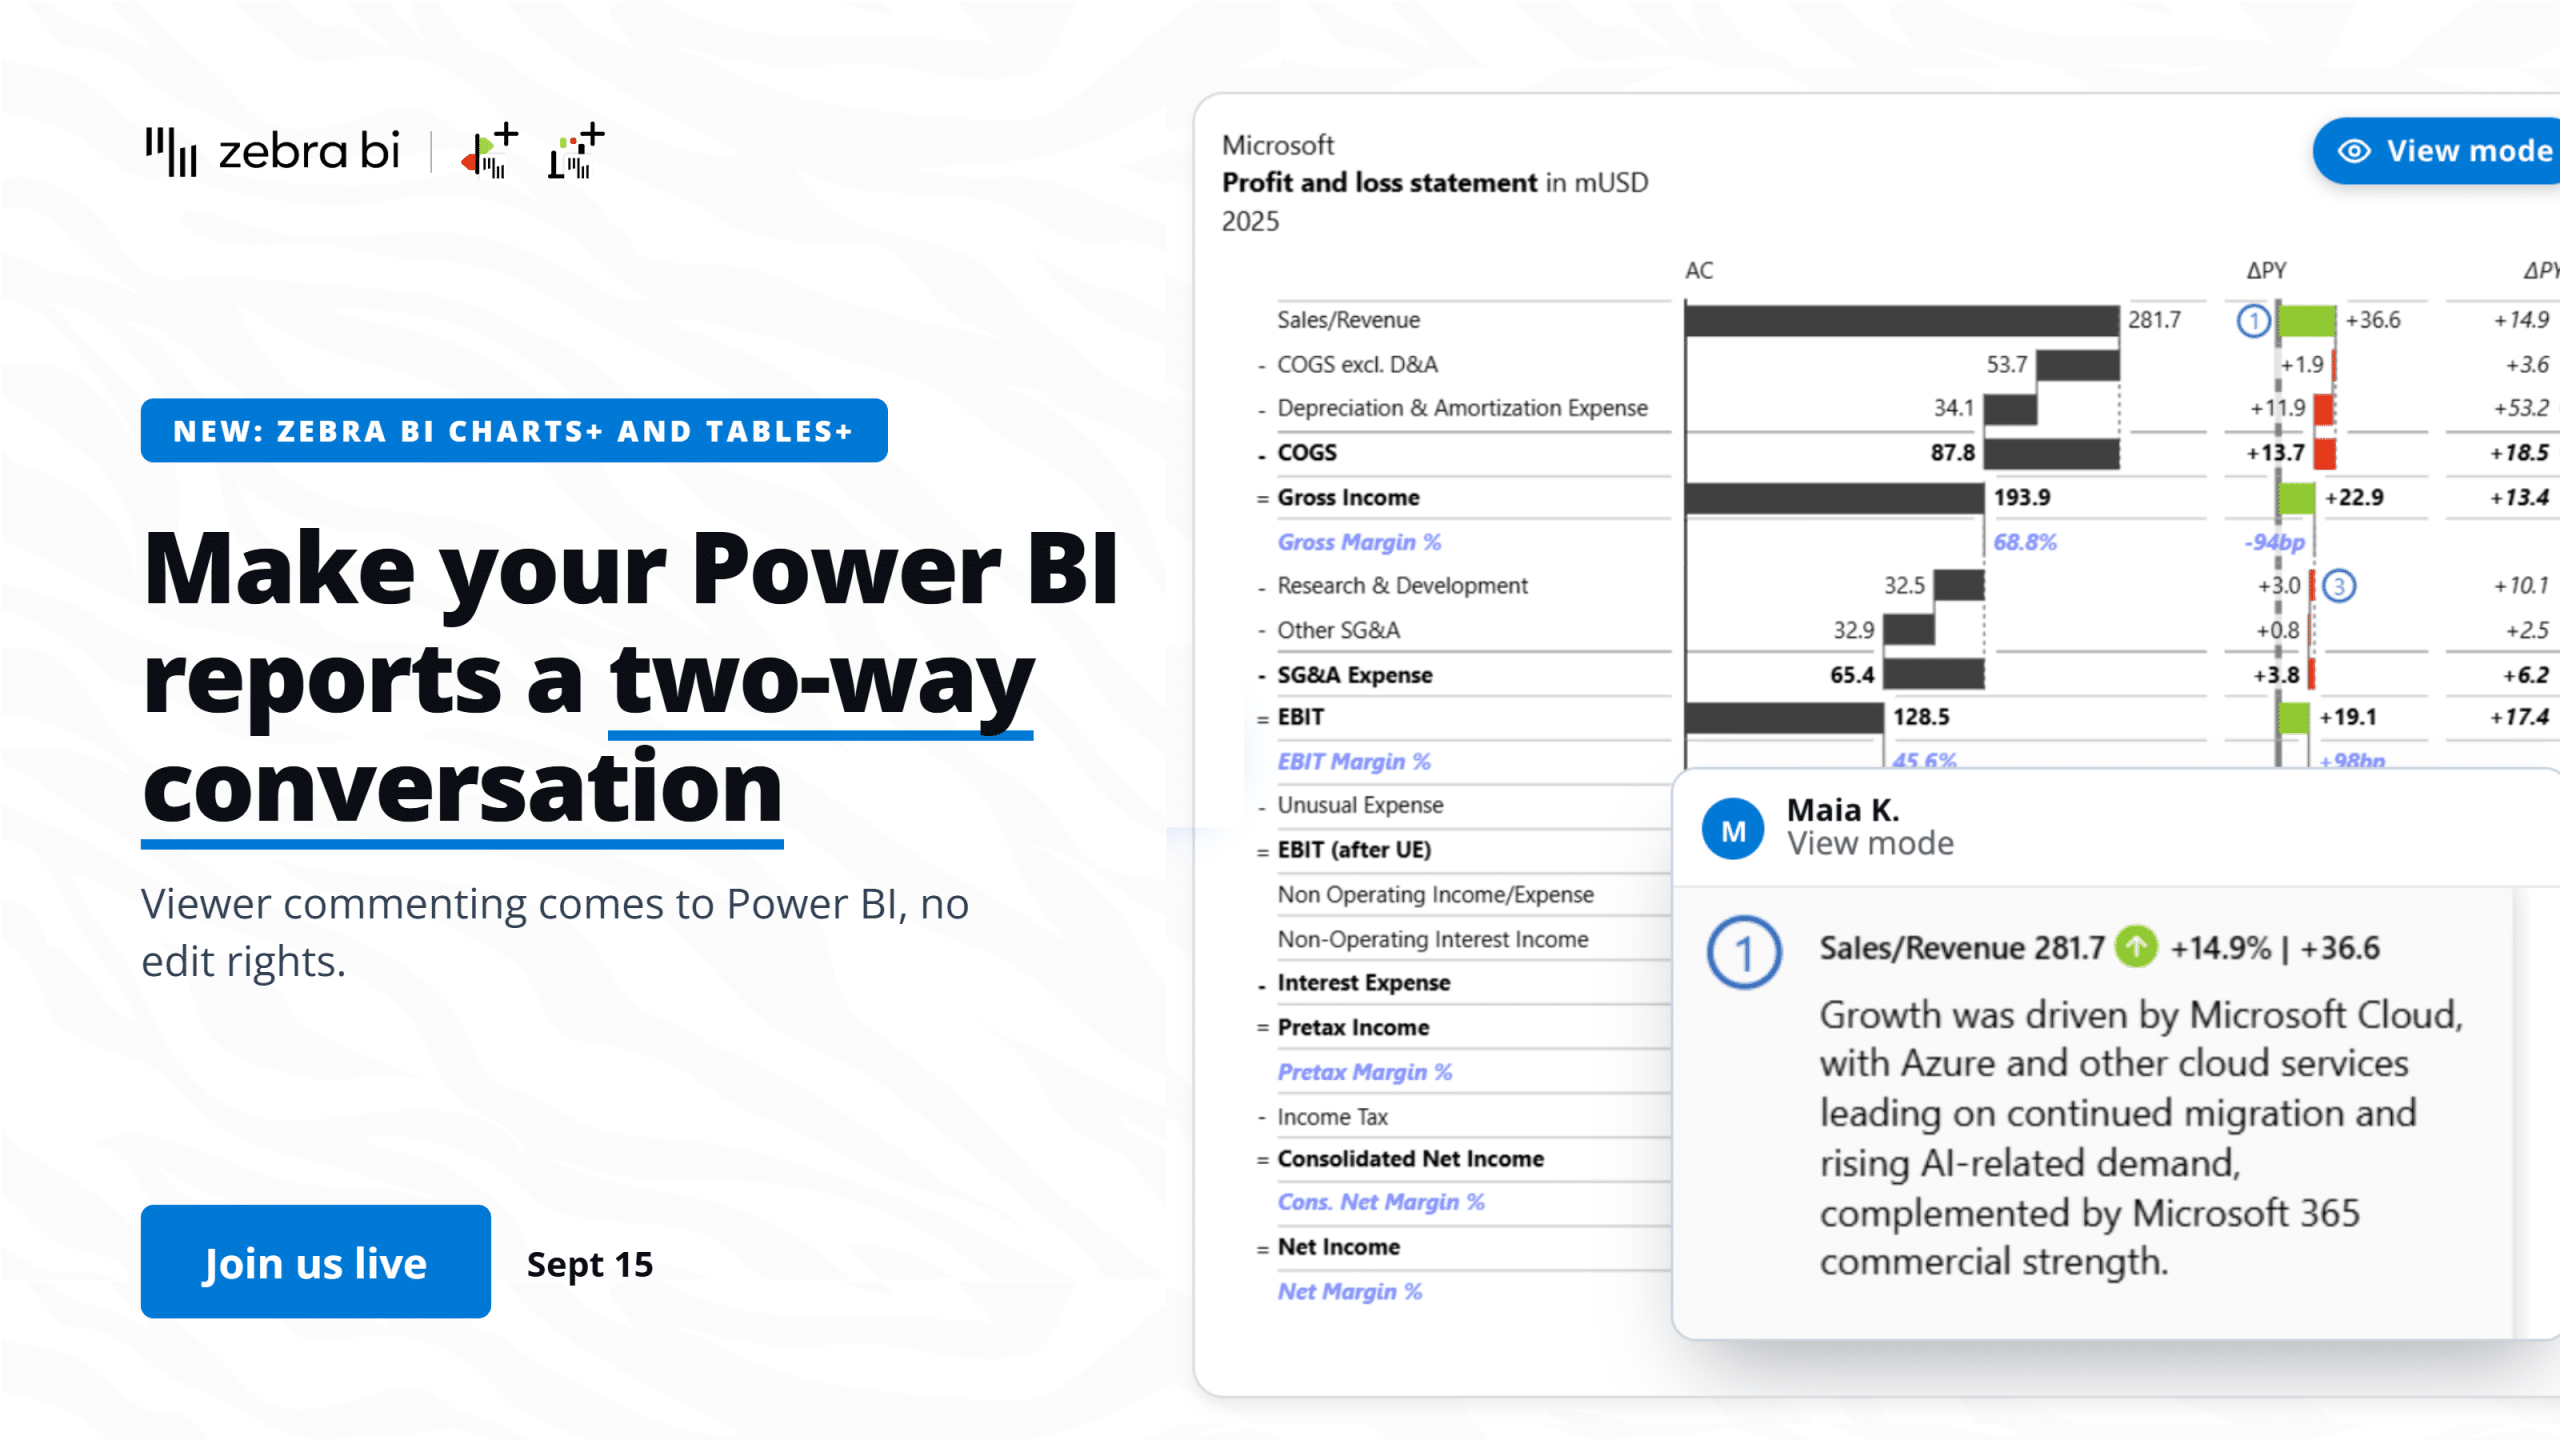
Report viewers can finally comment right on the data, in view mode, with no Power BI edit access. Andrej Lapajne and Mark Leskovšek launch Zebra BI Tables+ and Charts+ live on a real report, then take your questions.
Finance teams are debating dashboards vs AI. We're not going to debate. We're going to show. On June 4, we walk through 100 real company P&Ls (Nike, Tesla, Pfizer, Walmart, Amazon) across 6 industries and 6 years of public financial data, live, in a single report. See what great financial reporting looks like at scale.
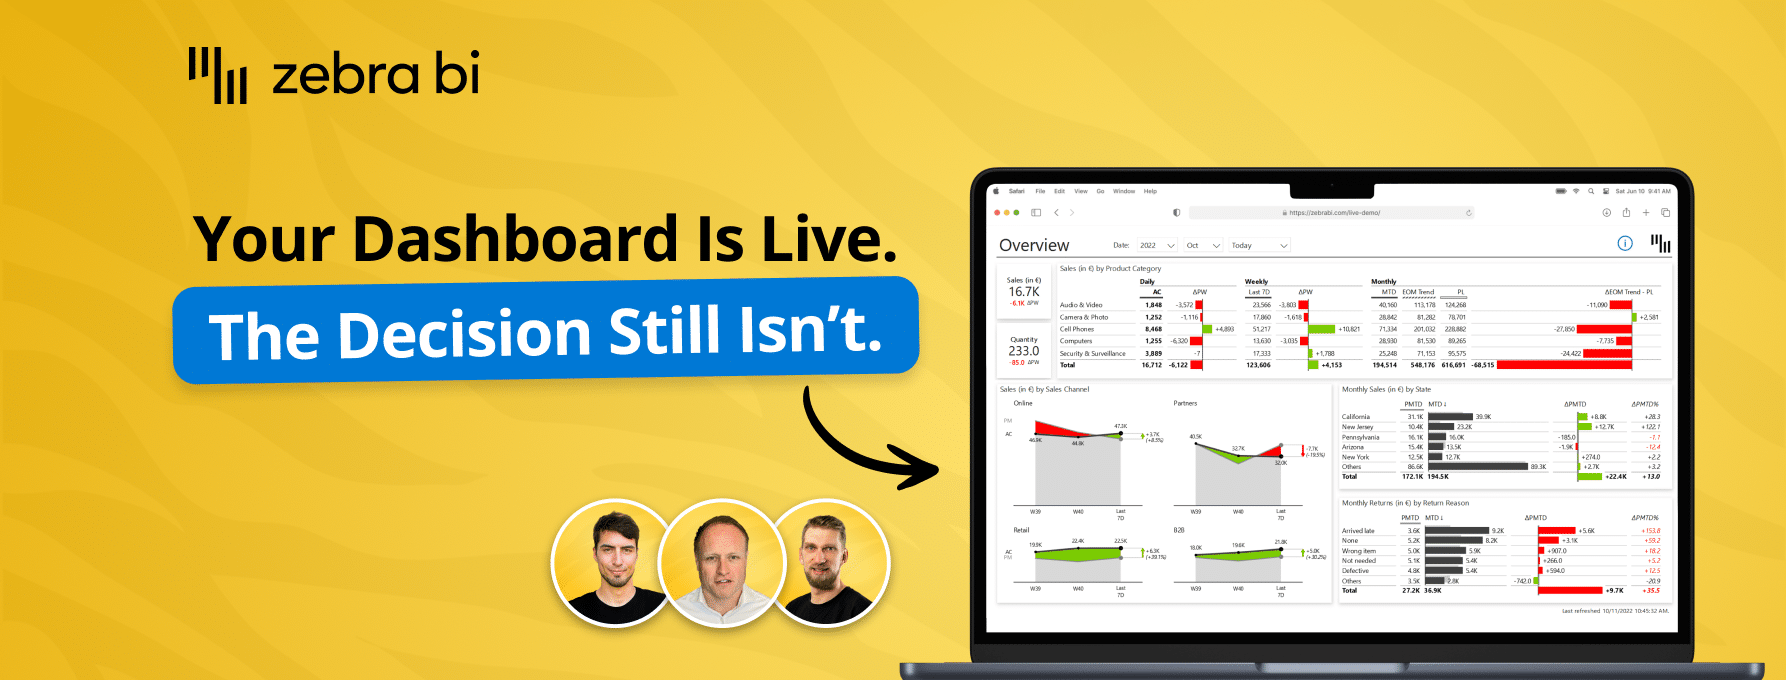
Your reports are ready. Decisions aren't. Learn how to close the Last Mile - live Power BI build, real client case, actionable framework. Free, 60 min.
Your reports are ready. Decisions aren't. Learn how to close the Last Mile - live Power BI build, real client case, actionable framework. Free, 60 min.

 September 8th
 February 22nd