 September 8th
 February 22nd
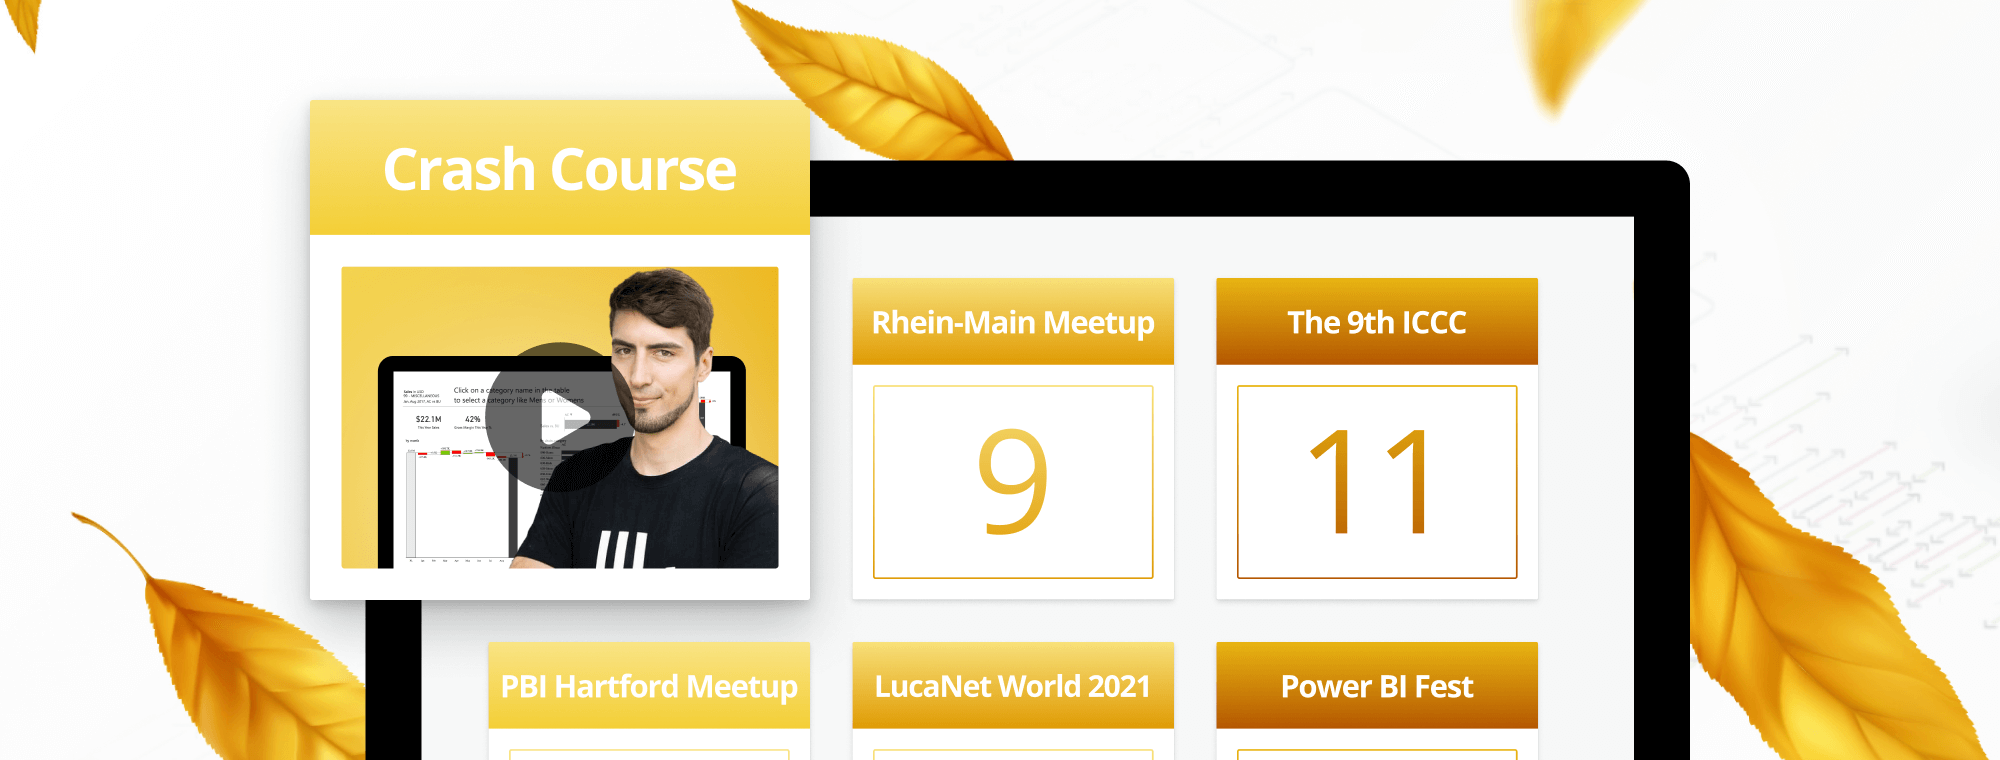
Fall News: crushing your reporting designer's block, community events & more
Hi there,
Before your inbox starts overflowing with December holiday wishes, we thought you’d benefit from some updates from the dataviz world, the Zebra BI space, and some educational content.
Because what could be a better way to finish your work week than getting inspired for days ahead? 🤷
Crush your reporting designer’s block with Zebra BI’s Crash Course
Have you ever stared at a blank Power BI page not knowing where to start? Fear not: that might have been the very last time. We launched the first-ever Zebra BI Visuals Crash Course to help you create your actionable sales dashboard in less than 30 minutes.
Zebra BI's Expert Mark who's helped hundreds of Zebra BI's clients already has prepared 5 short video tutorials that will help you create a sales dashboard in Power BI from scratch.
During the course, you'll make sure that time-intelligence functions work as intended, prepare basic measures to utilize Zebra BI visuals, and finally build a sales dashboard using both Zebra BI Charts & Tables.
Want to get inspired?
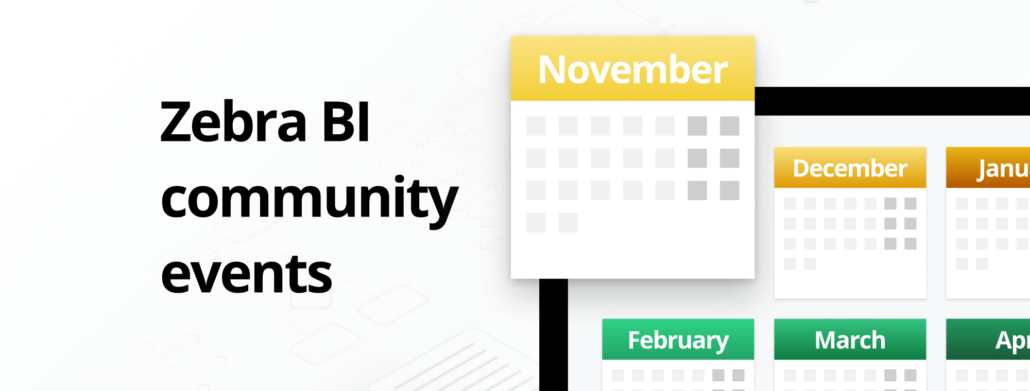
Diving into the event season
We can’t believe we’re already deep into the Autumn Event Season! You’re busy yourself, we know, but were you ever sorry if you took part in an engaging topic that helped you become better in what you do?
As the whole world is still mostly keeping events online, you can seize the opportunity to catch each of these community events and learn how to create better dashboards - even though they're spread out from Europe to the USA!
Join our dataviz community on one of these events:
👉 9th November: Rhein-Main Meetup
👉 11 & 12th November: The 9th ICCC - International Controlling Conference with Kontroling Kognosko
👉 18th November: Power BI User Group Hartford Meetup
👉 18th & 19th November: LucaNet World 2021
👉 24th November: Become an expert in Zebra BI for Excel in 1 day (Course) with partners BI Samurai
👉20th November: Power BI Fest
👉 25th November: Power BI User Group Romania Meetup
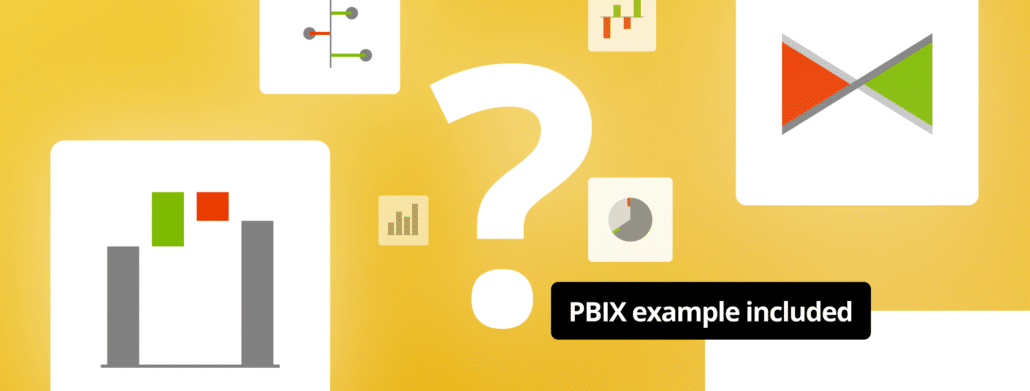
What’s an efficient chart?
It's a chart that requires the shortest period of perception in order to obtain a correct & complete answer to a given question. 💡
That's especially important if you're creating your reports and dashboards for the management that doesn't have a lot of time to study them.
But when it comes to charts in Power BI, it's not only about the right chart type, it's also about the proper control of chart elements that is extremely important in getting the right message.
The following guide is dedicated to choosing the right chart for your Power BI report.
A delicious dashboard? 🍫
Take a look at this delicious (and insightful!) Power BI dashboard created with Zebra BI visuals!
This "Milka dashboard" was developed and shared by Sasjah de Jager, a report creator that often takes our breath with his out-of-the-box Power BI dashboards and is highly engaged in the Zebra BI community. Great work as always!
Below you can explore the dashboard that includes a creative solution to the navigation and custom tooltips. You can also watch a video of the detailed presentation included in Sasjah's Linkedin post.
In other news
We recently surpassed 9,000 followers on Zebra BI's Linkedin channel thanks to you – we're grateful for your support! Any ideas on how we should celebrate the 10k?
Or more importantly: are there any topics that you'd like us to dedicate our attention to? Just leave a comment by the end of this post!
Not a fan of Linkedin? In that case, we can meet on YouTube or on Twitter. See you!
Webinars to watch right now
There's a couple of webinars you shouldn't miss this time.

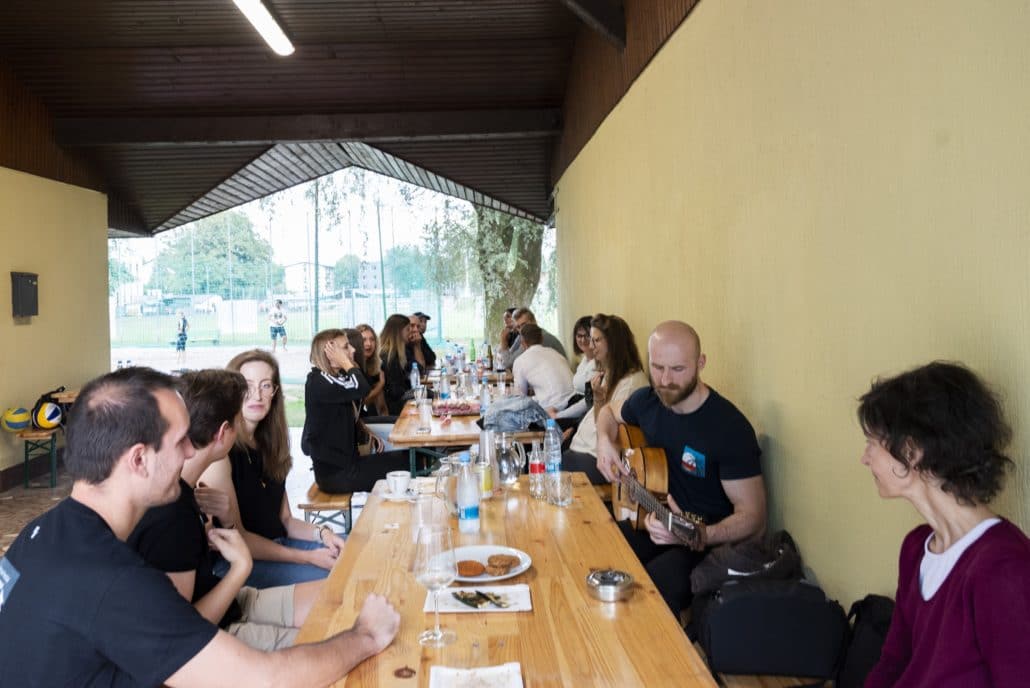
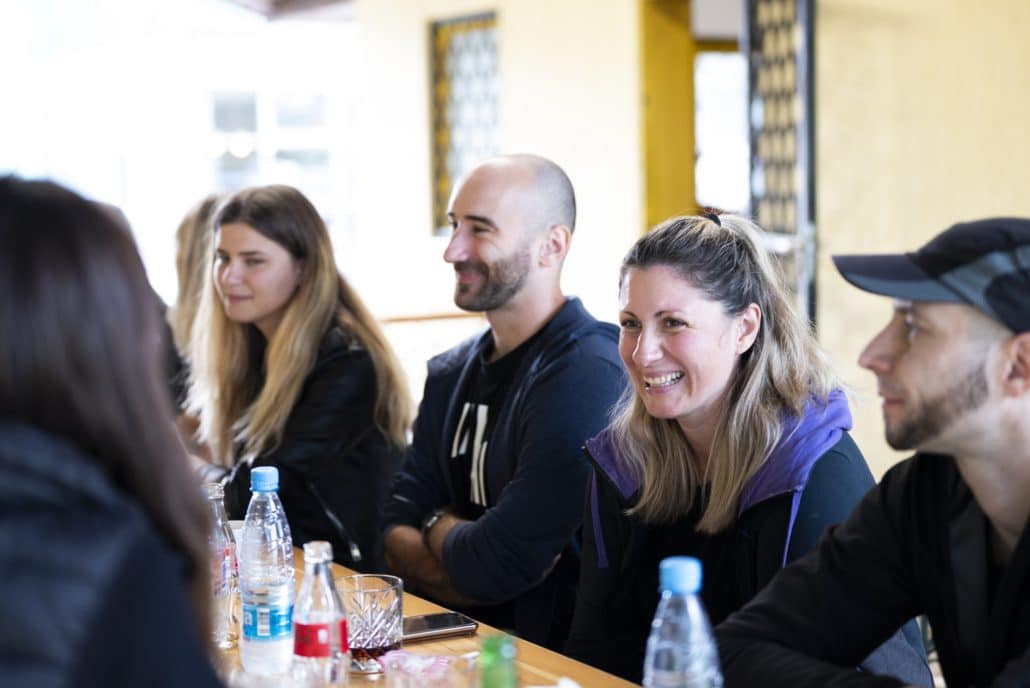
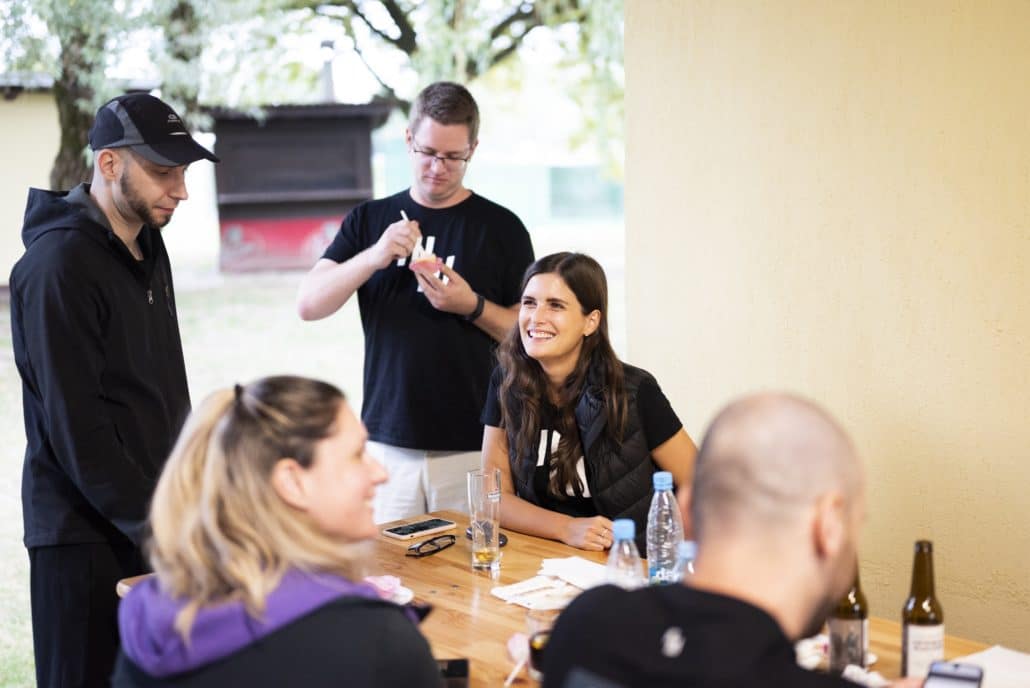
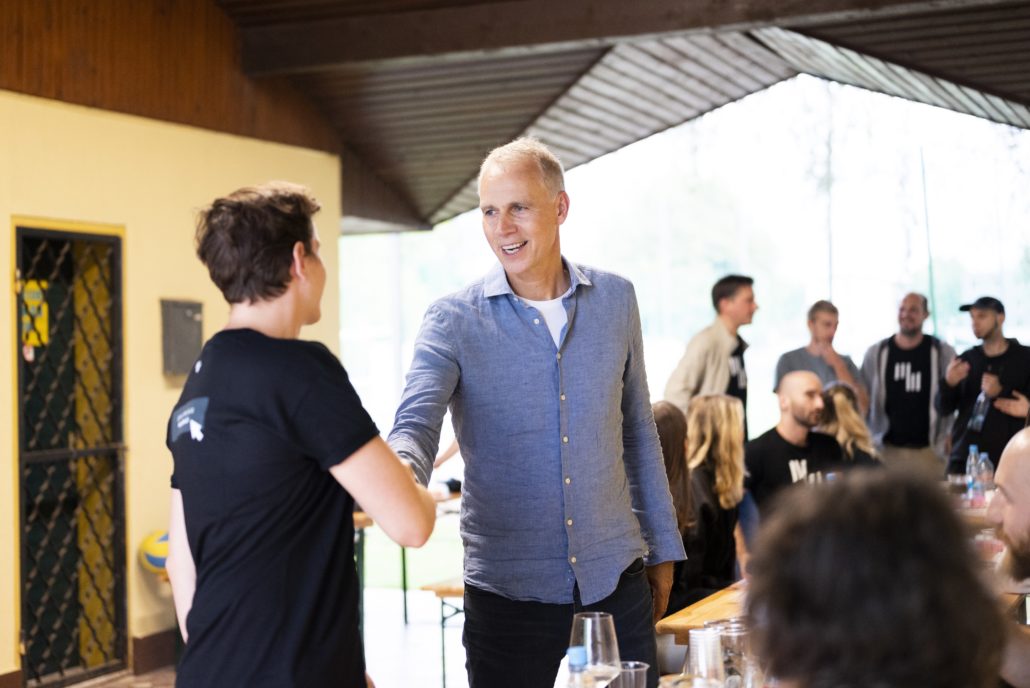
The team met up again 💬🍔
By the end of summer, the Zebra BI team recently met up again.
Different teams meet in person only once in a while, so we really had to cover a lot of topics! We believe the hybrid office is the way to go as it offers flexibility, and we easily adapted to this way of working throughout the previous periods.
As it was getting chilly, most of the Zebras were happier chatting and listening to our coworker Dušan playing guitar rather than engaging in sports as the last time we met. 😉


Last but not least... 🤫
In the previous months, the Zebra BI team has been creating something BIG. We can't yet tell you what, but we promise you'll know about it soon and you'll almost surely LOVE our solution.
For now let us just say: watch this space!
Stay in the know: join the newsletter
By joining below, you'll receive quarterly newsletters like this one, webinar invites, and product updates - to your email.
Join other dataviz enthusiasts like yourself and we'll make sure you won’t miss out on any important news in the Zebra BI space.
Amazing work guys! Bravo!
Loving the photos. Hopefully I can meet you soon in Ljubljana, Slovenia 😁
Thanks, Carlos - and surely do let us know if you're around!