 September 8th
 February 22nd
Zebra BI August Product Update
A monthly update that you never want to miss out on?
It's Zebra BI's product updates, of course - that always empower you with new dataviz knowledge and news from the Zebra BI world. As always, all in order to help you improve your reports and dashboards and make them even more actionable.
This month, you'll be happy to hear about the new HR Analytics template in Power BI, that allows users to get a clear overview of the company's employees and the most relevant top-level KPIs. In case you're just starting your Zebra BI journey, we'd also like to present to you the beginner's guide that will make your first steps in Zebra BI for Power BI much easier.
Lastly, as summer is coming to its end and people are returning to their (home) offices, it's time for a new webinar. This time, you'll learn about how to make your Power BI dashboards run smoothly and seamlessly.
Let's jump right in! Watch the August Product Update here 👇
New: HR Analytics template in Power BI
It looks like you've all really waited too long for this Power BI template! It's beginning to become the most popular one so far. This month, our focus was on HR analytics.
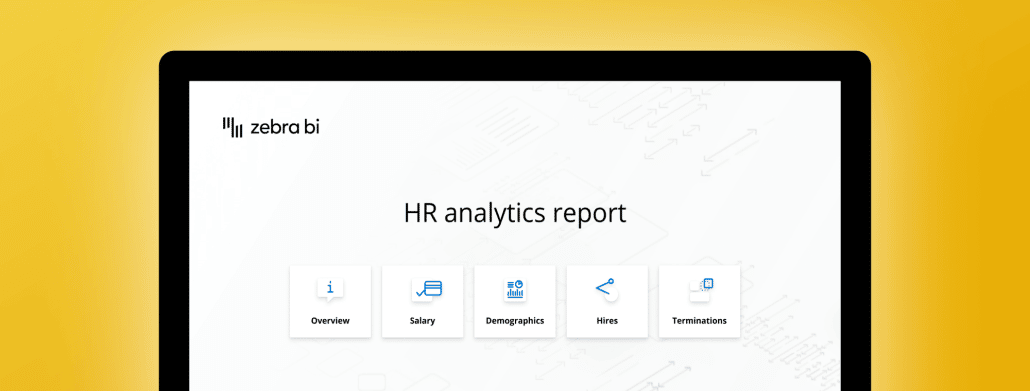
The Human Resources Power BI dashboard allows users to get a clear overview of the company's employees and the most relevant top-level KPIs: Headcount, Salaries, Hires, and Terminations. The 4 subsequent pages provide a more detailed view of each of the KPIs and the demographics.
The landing page already includes some reporting elements – the icons function as navigation buttons to different report pages where topics like Salary, Demographics, Hires, and terminations are covered.
Additionally, you'll find a “report tutorials” button where some tips on how to use a report are presented which can provide a better understanding for the end-users.
On the overview page, there are some top-level KPIs and category splits including Employment type, Education, and Satisfaction. In the top right, you can use report navigation to move on to the next page and dig further.
What does it all look like? There's a full demo of this template in the August Product Update video above!
New to Zebra BI? Then this guide is a must-watch for you!
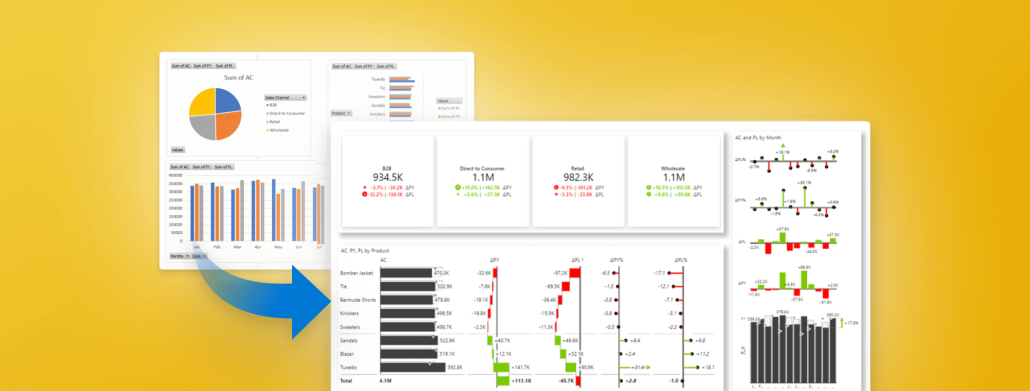
One of our BI specialists, Lili Alesnik, remembers what was her biggest struggle when she began her Power BI journey. She admits the hardest part was transforming a given data set into powerful visualizations and a clear message for the viewer.
That's why she created this beginner's guide that shows you how to build your first Zebra BI dashboard in under 8 minutes.
You'll use Zebra BI Cards to present top targets, and Zebra BI Tables to get into the detailed structure. You'll finish off by presenting time trends with Zebra BI Charts and having a look at the report to get some insights.
The best thing is, that you really don't need any Power BI knowledge to be able to build this outstanding report.
Why not begin right now?
New live webinar: How to make your reports run 10x faster?
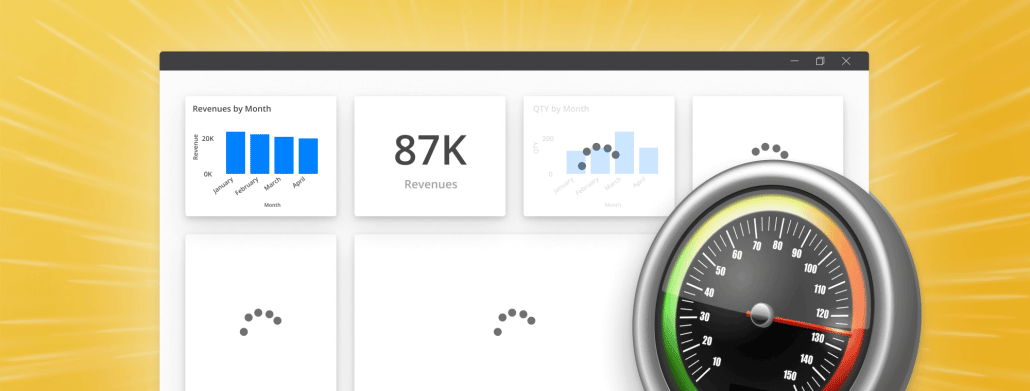
The new season of Zebra BI webinars is just around the corner. This time, we'll tackle the issue of really slow Power BI reports that take ages to load. We've all been there and we know your reports could run faster too!
During the webinar, we'll cover two topics that affect the speed of your Power BI reports:
- Your data model design and
- The best way to structure and organise your visuals
Why stick with your slow Power BI reports forever? When you can have them run smoothly just by implementing the methods that you'll learn during the webinar.
Join us on September 8!
Receive important updates directly into your inbox
Join other dataviz enthusiasts like yourself and we'll make sure you won’t miss out on any important news in the Zebra BI space - like this monthly product newsletter.
See you next month!