 September 8th
 February 22nd
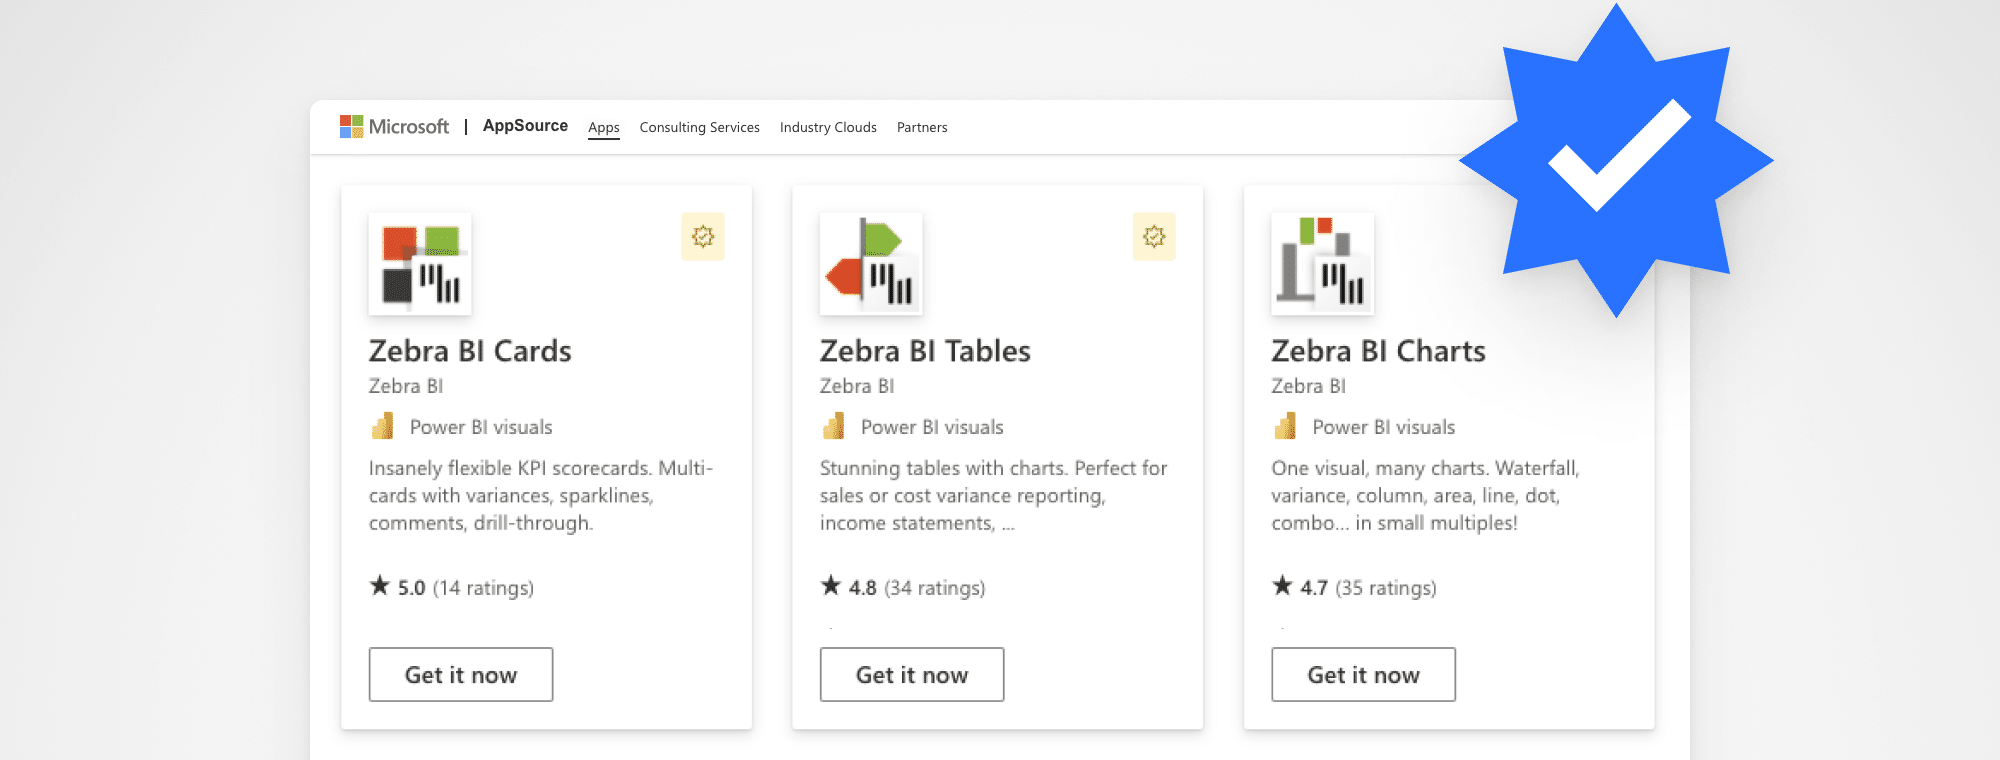
Microsoft approved: Zebra BI Cards visual for Power BI is now certified!
In December 2021 Zebra BI launched a new visual for Power BI that has transformed the way KPIs are represented in Power BI dashboards.
Just a couple of months later we’re celebrating another key milestone. Microsoft has just certified Zebra BI Cards visual which means that it guarantees it to be completely secure and allows you to take advantage of a few additional features only available with certified visuals.
The latest addition to the Actionable Reporting toolkit: Zebra BI Cards visual
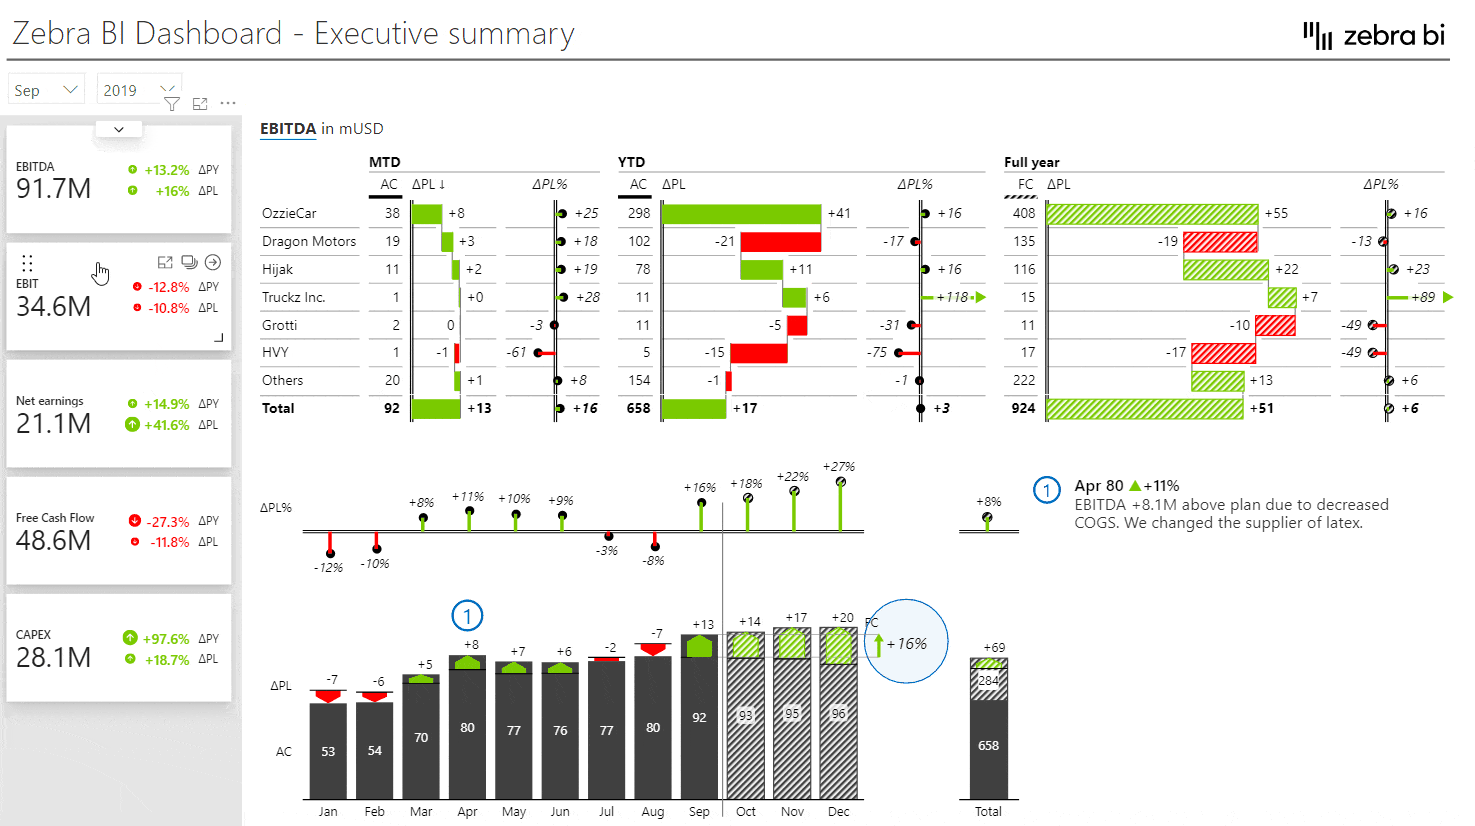
With the Zebra BI Cards visual, the toolkit for Actionable Reporting is now complete. It represents the last missing piece to building extremely flexible entry pages for your reports and dashboards showing all relevant data for the most important KPIs.
By using its advanced functionalities like Dynamic comments, Scaled groups, Drill-through, or Focus mode, you're able to get relevant information and context behind the data, that's usually critically missing in KPI dashboards.
Combined with Zebra BI Charts and Tables visuals, the Zebra BI Cards visual is ideal for a complete understanding and efficient storytelling of your company’s performance.
About the Microsoft certification
The achievement is a result of a thorough process and several detailed code reviews by Microsoft.
Certified Power BI visuals are those AppSource visuals that meet the Microsoft Power BI security and other code requirements. They're thoroughly tested by Microsoft to verify that they don't access any external services or resources and that they follow secure coding patterns and guidelines.
We are proud and honored that Zebra BI Cards visual is joining our other two visuals, Zebra BI Charts and Tables, as part of the highly selective group of Microsoft-certified add-ins for Power BI.
The certification badge is displayed in the AppSource:

What does this mean for our users?
The certification has several benefits for its users:
- Exporting to PDF and PowerPoint from the Power BI (cloud) service
- Printing from Power BI service
- Email subscriptions
Exporting to PDF and PowerPoint
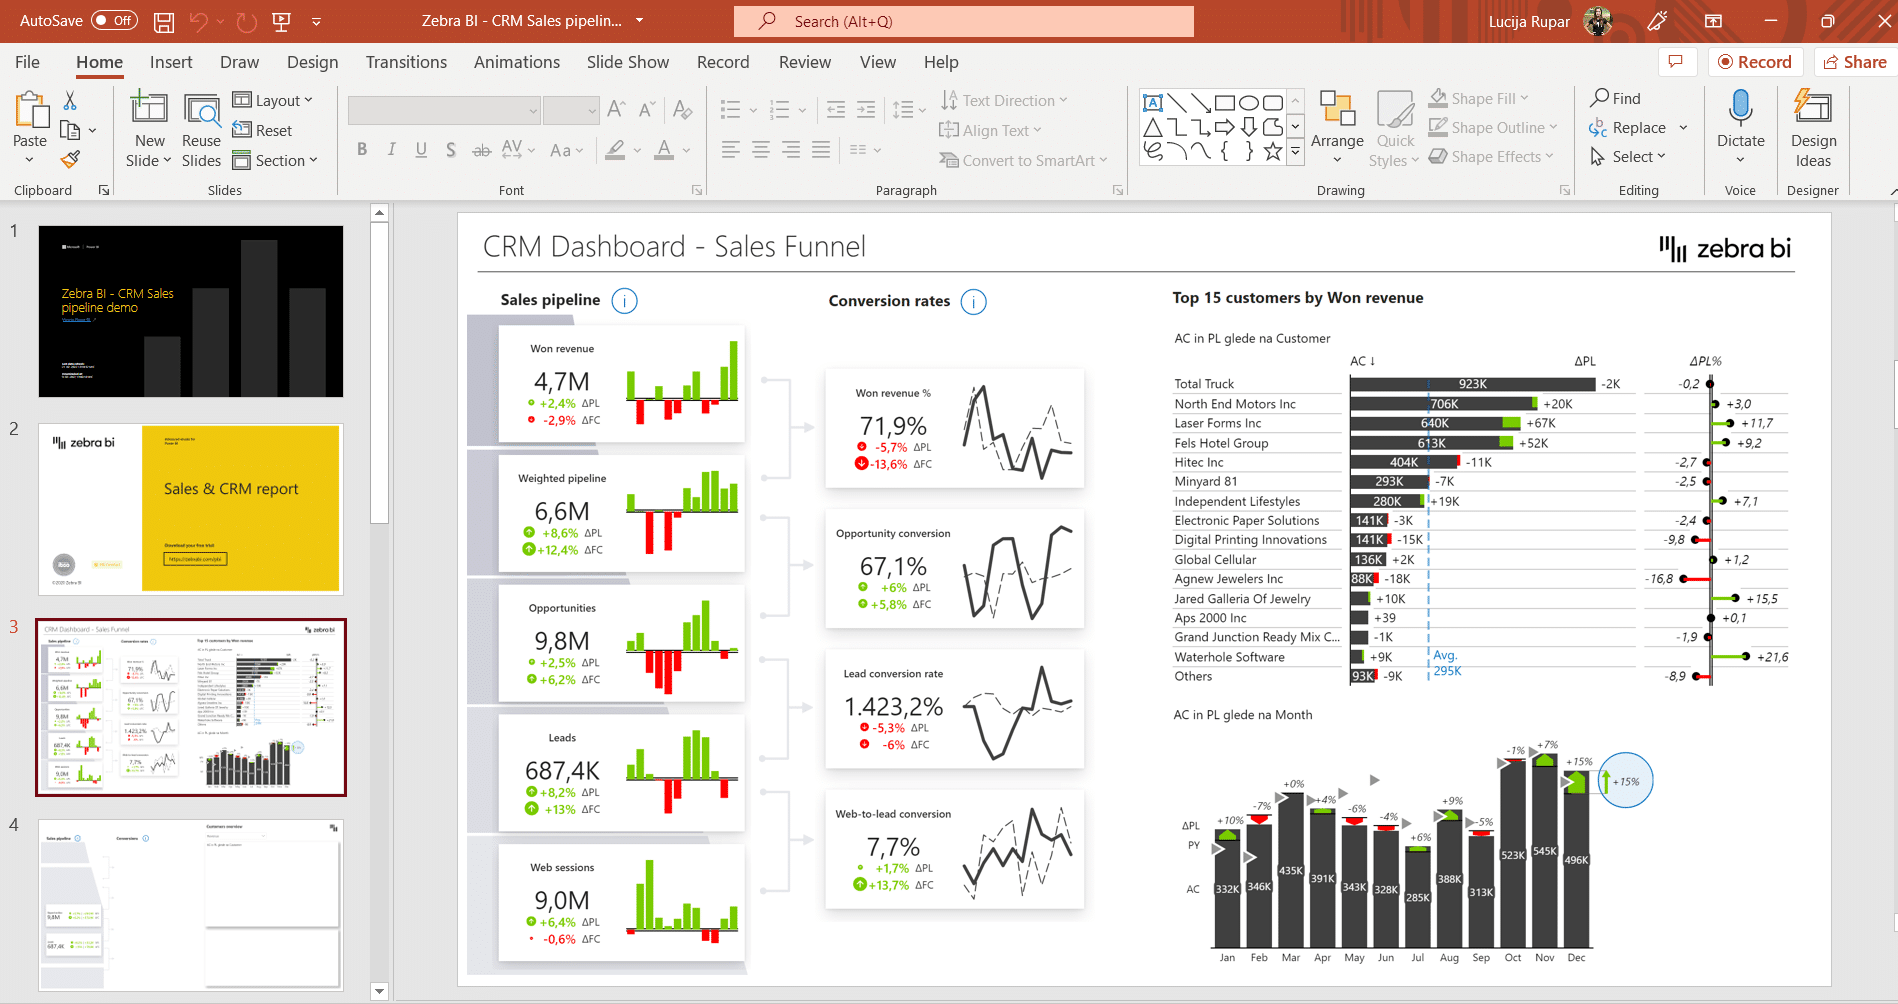
Now that the Zebra BI visual is certified by Microsoft, you have the ability to export your Power BI reports created with any of the three Zebra BI visuals directly from the Power BI (cloud). You can do it in a form of a PDF or PowerPoint presentation.
And that's all done in just a few simple clicks. When you open your report, click on Export and choose your preferred export format:
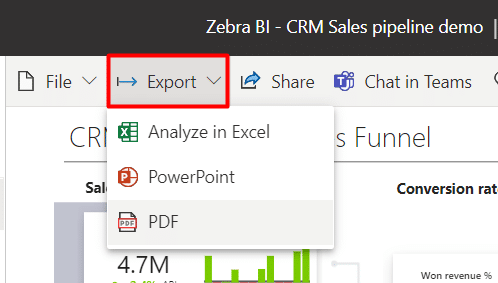
Once you perform this action, Power BI will check all of your report pages (warning: this can take a few moments) and create a nicely rendered PDF document or a PowerPoint presentation:
Email subscriptions: send automated emails to your end-users
With this frequently overlooked but very useful feature you can send automated emails based on your published Power BI reports to your end-users (consumers) on an hourly, daily, weekly, or monthly basis.
Additionally, you can send these emails to an unlimited number of recipients to their favorite email client.
But wait, there's more. You can schedule these emails for every Power BI report published in the Power BI service, select the exact days, the time of day when an email should be sent, write the email subject and an optional message, control the start and end date of each email subscription, etc.
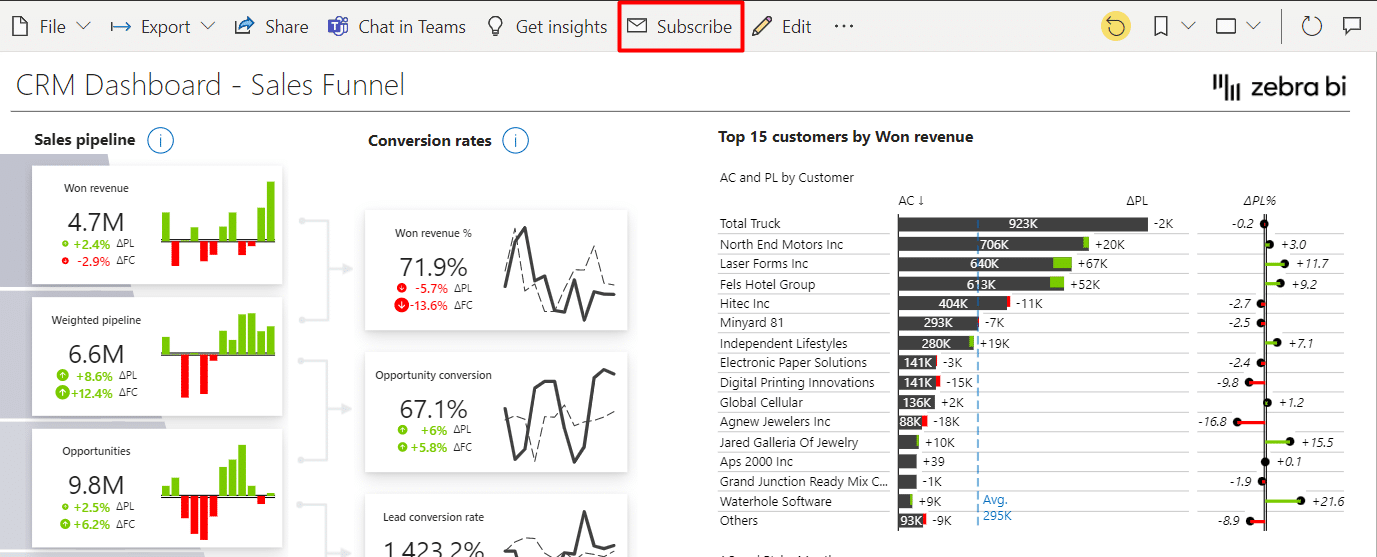
Let's see how you can do it. To set up email subscriptions, first click on the Subscribe button in Power BI service:
You'll be presented with a form where you set the details of this email subscription on the right-side of your window:
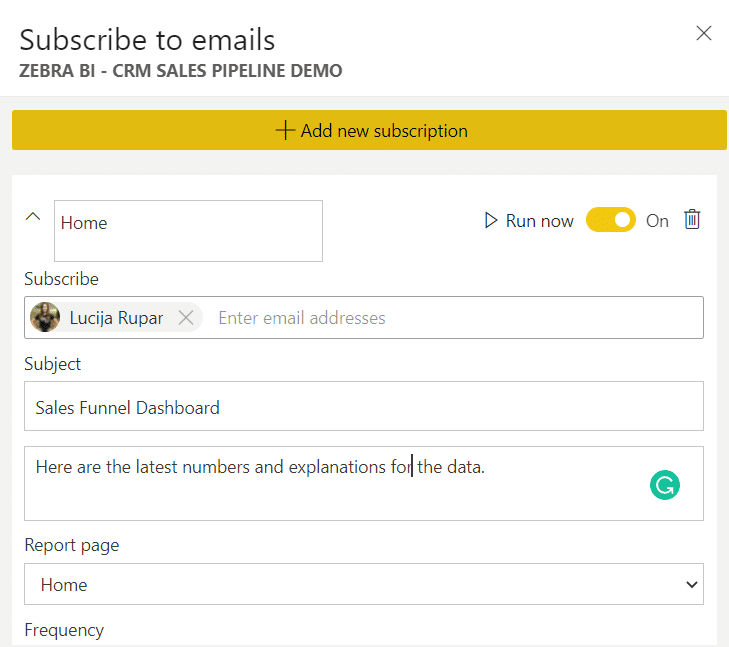
After choosing subscribers (the users who will get these emails) and writing an engaging Subject to your new email, make sure you select the most appropriate schedule. For example, on a weekly basis, you can select the exact days when the emails will be sent out, as well as the exact scheduled time of the day (based on the selected time zone):
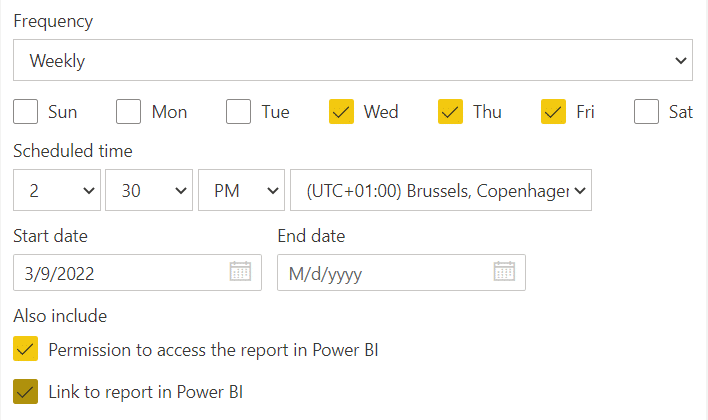
As you can see from the above pictures, you can simply set the start date and the end date of each subscription.
Friendly advice: by default, the emails will include a link to the whole Power BI report. If you want to restrict your users to a mere preview of a selected page in your report (and NOT give them the option to view the whole report), then just uncheck the checkbox under Also include (link to report in Power BI).
Interactive example on Zebra BI visuals
With Zebra BI Cards visual you can create efficient landing pages for your reports and dashboards that contain all the necessary information for each KPI. Together with Zebra BI Charts and Tables you can divide deeper into the details and understand the why behind the performance.
It's time you give it a spin!
If you're already using the AppSource version of Zebra BI Charts and Tables visuals, you can simply add a new visual by following the steps below:
- In your Power BI click on the three-dotted icon (...) in the Visualizations pane and select Get more visuals. Search for "Zebra BI Cards" in the AppSource to find the visual and add it to your Power BI Desktop.
- Click on the icon in the Visualization pane to insert the visual into the report page. The visual will display a blank landing page ready for you to insert your data into it.
- To unlock the Pro version of the visual, copy and paste the license key you’re using for the other two visuals to the activation window.
- Pin Zebra BI Cards visual to the Visualization pane.
You can find more detailed instructions on how to in the Initial setup guide in our Knowledge Base.
Excelente informacion
Thank you Hector 🙂