 September 8th
 February 22nd
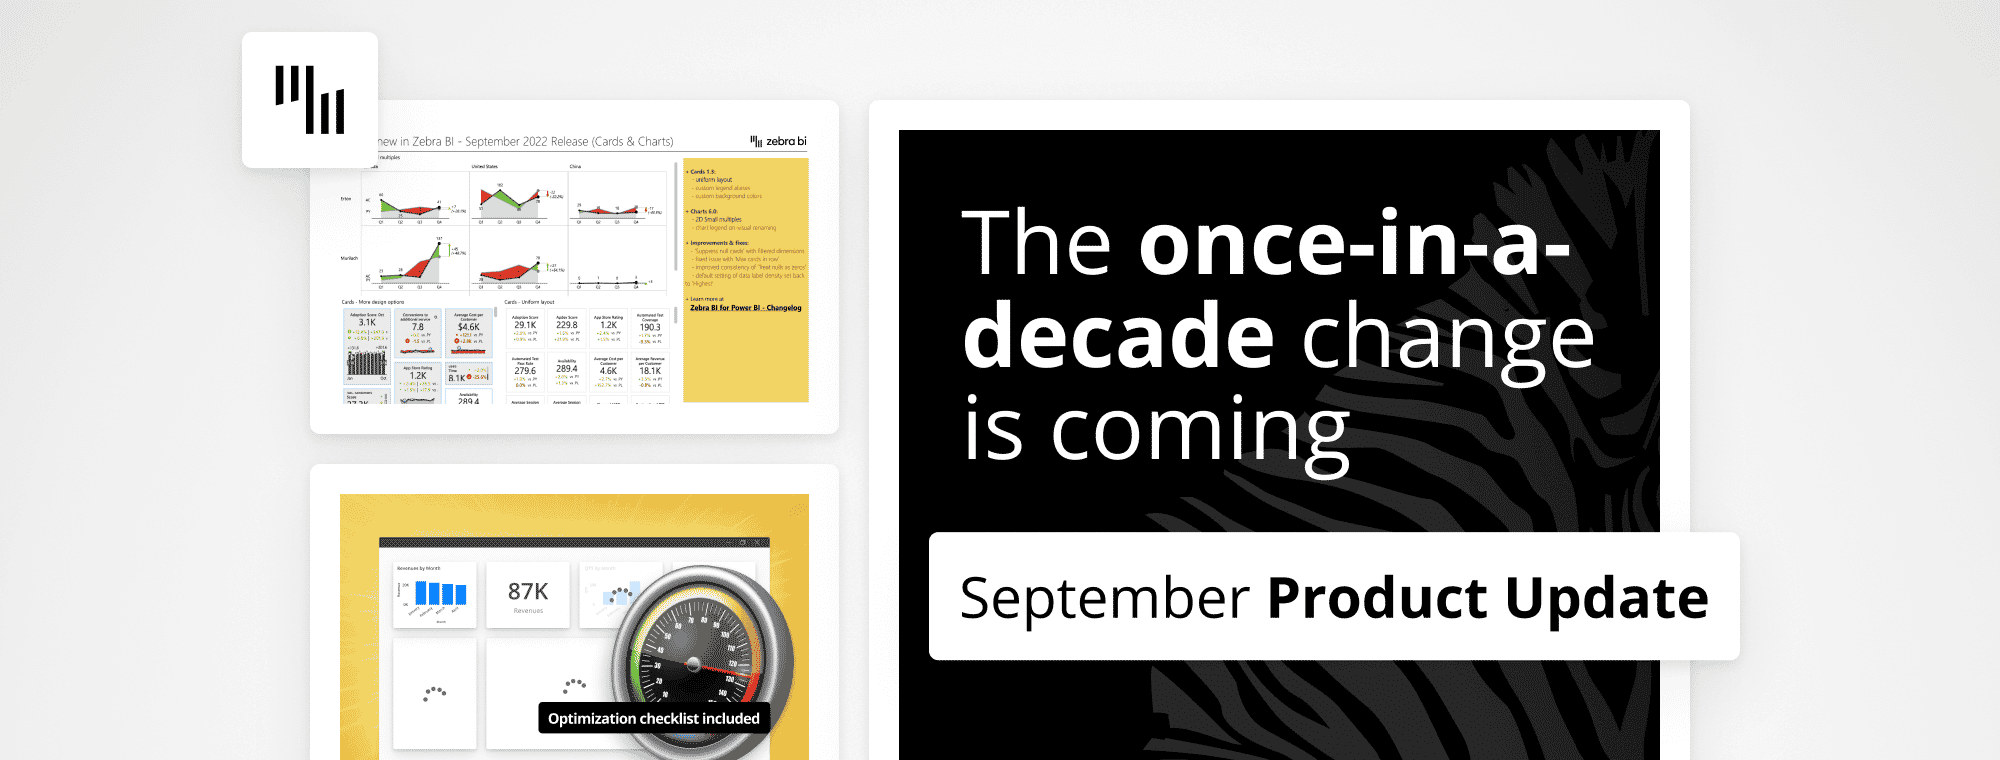
Zebra BI September Product Update
Is it hot in here or is it just our product updates? 🔥 With the summer drawing to a close, we've timed them perfectly to keep your data warm for a little while longer.
Here's a wrap up of everything we've been working on in the past month to make your reports and dashboards even more actionable. Take your reporting to a whole new level with our cool new features, exciting insights and one big, game-changing announcement.
Let's dive right in!
Zebra BI Tables 6.0 release: brand-new visual, huge performance optimization & so much more!
We're so happy about this one. Zebra BI Tables 6.0 is finally here! This is an all-new visual that's going to make all the difference in your day-to-day business. And here's why.
To begin with, Zebra BI Tables 6.0 brings a huge performance upgrade, making data loading time in tables with hierarchies up to 50x faster! This establishes Zebra BI Tables 6.0 as the fastest custom visual for complex matrix scenarios. 🚀 Hello, blazingly fast reports!
On top of that, it now enables you to customize the highliting of the rows, adapting your reports so that they better suit your needs. Set the row hover to bold, highlight it with your preferred color or just turn it off completely. Let your data tell the most beautiful story – one that's even more accessible to your end-users.
Next, we have some thrilling new drill options! They enable you to drill into every last detail of your data with lightning speed. This way, you can gain a deeper understanding of your data and make your reports even more interractive. Reviewing your data has never been so efficient!
And there's more still. Have you ever wanted to just bookmark settings in your reports with Zebra BI Tables? Well, now you can – any of them, for that matter! This will allow you to save any view you like for the next time you might need it. Perfect for when you want to have many different views within the same visual and switch seamlessly between them.
Last but not least, our calculations manager! With this release, you can simply review all custom calculations within a visual in just seconds. All it takes is a few simple clicks.
Zebra BI Cards 1.3 release: uniform layouts and background color
This release is all about exploring different design options. Aside from custom and row layout design, you can now also opt for the uniform one. This is perfect for when you want all your cards to be of the same size, whatever you choose it to be. As a result, Zebra BI Cards is now the only visual on the market that allows you to seamlessly switch between as many as 3 different layouts for displaying KPIs.
Another neat and highly anticipated feature is different color options. You'll be happy to learn you can now define a global and individual card background color and even global border colors. And what exactly does that mean, you might ask? That your reports and dashboards can now exactly match your company branding – awesome, right?
Zebra BI Charts 6.0 release: 2D small multiples and improved legend UX
That's right, we've brought back one of the most distinguishing Zebra BI features – the multidimensional small multiples! They enable you to compare multiple data categories and immediately get a deeper insight into your business drivers. You'll be happy to hear the charts are also perfectly scaled to help you interpret your data correctly.
Legend UX has just been upgraded with a cool new feature too. Starting now, you can rename your legend entries directly on your visuals and manage your charts more easily. Talk about flexibility!
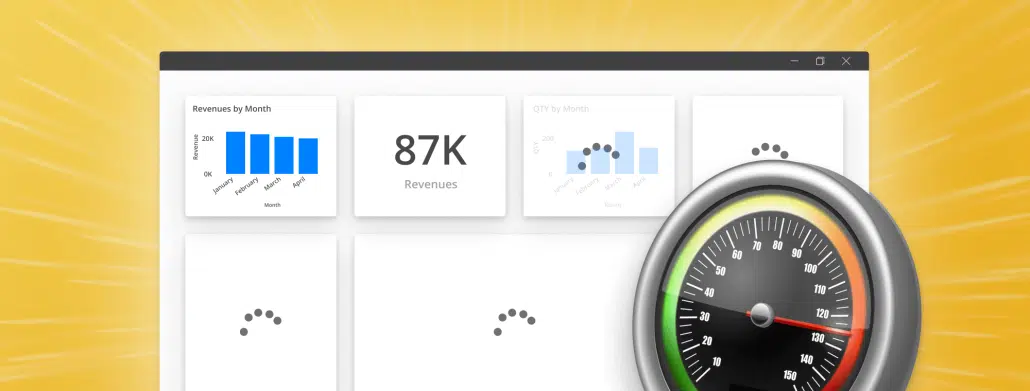
New live webinar: How to make your reports run up to 10x faster?
Slow reports are such a struggle! But don't worry, we have just the fix to speed them up and we've covered it all in our latest webinar. Feel free to check it out if you haven't already, it might just save you years of waiting. 😉
Join the Zebra BI CEO & Founder Andrej Lapajne as he walks you through the entire performance optimization process, starting with how you can diagnose performance issues in your reports. On top of that, he also provides some best-practice guidelines, real-life examples and even a quick checklist to help you make your reports up to 10x faster. You don't want to miss this one.
If you prefer to get your tips in writing, we got you! Check out the step-by-step guide we've published on the subject, along with detailed instructions and informative images that will make optimizing your reports as easy as falling off a log.
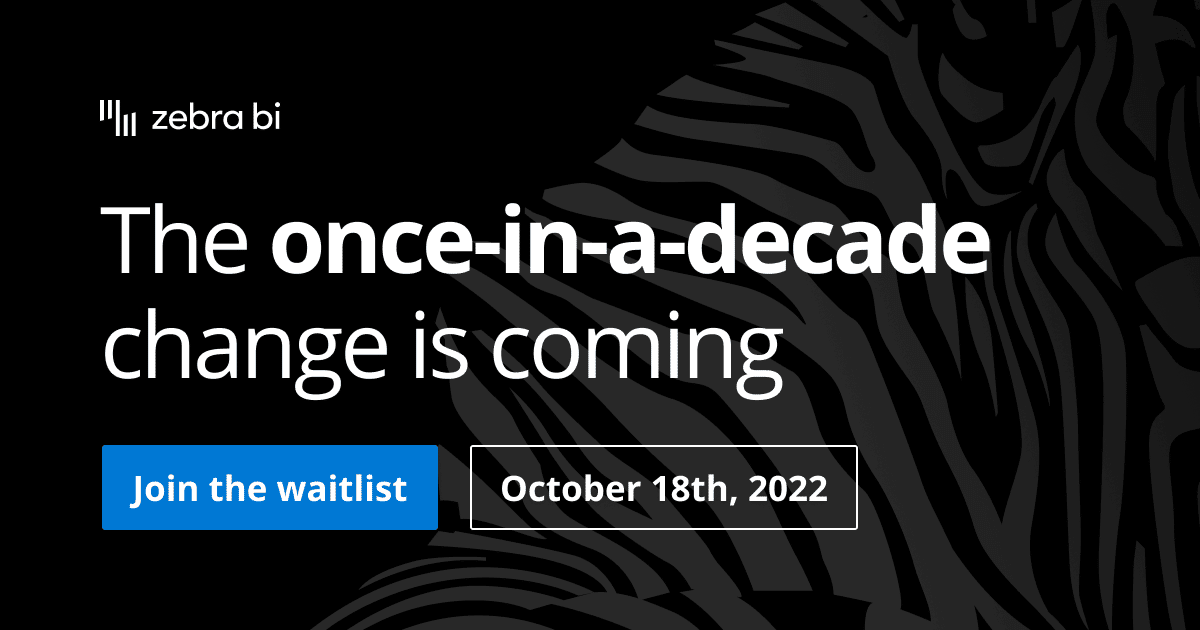
Zebra BI for Office: Join the waitlist
Get ready because this is going to be huge. After months of hard work, we're proud to announce the biggest reveal of 2022: Zebra BI for Office! On October 18, your reporting in Excel and PowerPoint is going to change forever – and you'll definitely want to be there for it.
Make sure to sign up and grant yourself EXCLUSIVE access to all of the following on launch day:
- the once-in-a-decade LIVE reveal
- NEW Zebra BI for Office
- 20 best-practice report templates made to impress
Receive important updates directly into your inbox
Join our dataviz enthusiasts' community and we'll make sure to keep you posted on any important updates on the Zebra BI universe. 👇