Author: Ziga Milek

June 3, 2015
Exclusive interview with Dr. Rolf Hichert, part 2 of 3
Learn some practical tips to successfully implement IBCS in your company, as well as why Mozart didn't add a little 3D effect to notes in his sheet music.
May 12, 2015
Exclusive interview with Dr. Rolf Hichert, part 1 of 3
Learn why it's important to introduce standardization in reporting, some examples, and what are the most important concepts in IBCS.
May 8, 2015
The 3 steps to implementing management reports in a pharmaceutical company
The project made in collaboration with a Serbian pharmaceutical company aimed to make management reports more transparent, visual and automated.
April 22, 2015
Infographic: How to Choose the Right Chart
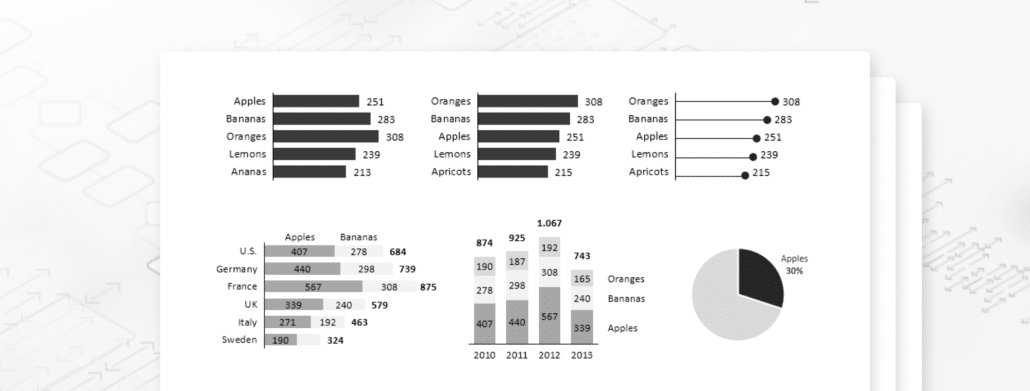
This infographic will teach you everything you need to know to always select the perfect chart. Link to free whitepaper with more information included.
April 21, 2015
The recording of our second webinar on data visualization is online
Learn the key methods of data visualization, 7 must-learn visualization rules, the details of waterfall and other advanced charts and more.
April 14, 2015
Data visualization in depth
Most reports and dashboards fail because of inappropriate or bad visualization. Check which efficient methods of data visualization to use.
April 8, 2015
Watch our 2nd webinar on data visualization next Tuesday
We’ll talk about efficient methods of data visualization. We’ll explain the data ink theory and how to apply it in practical examples.
March 20, 2015
The webinar recording is up!
If you missed our first webinar on best practices in designing financial reports, you can check the recording of the webinar on our website.
March 17, 2015
Best practices in designing financial reports
Often financial reports do not get the message across to the management. Learn our tips on how to create efficient reports and dashboards!