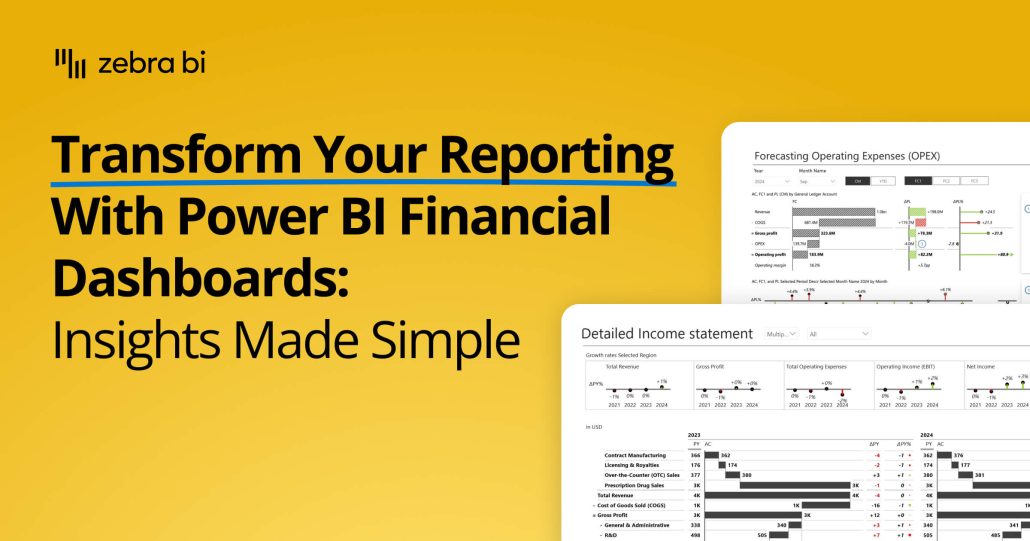
Transform your financial dashboards in Power BI. This guide shows you how to build lean, insightful reports for P&L, trend analysis, and cost management.
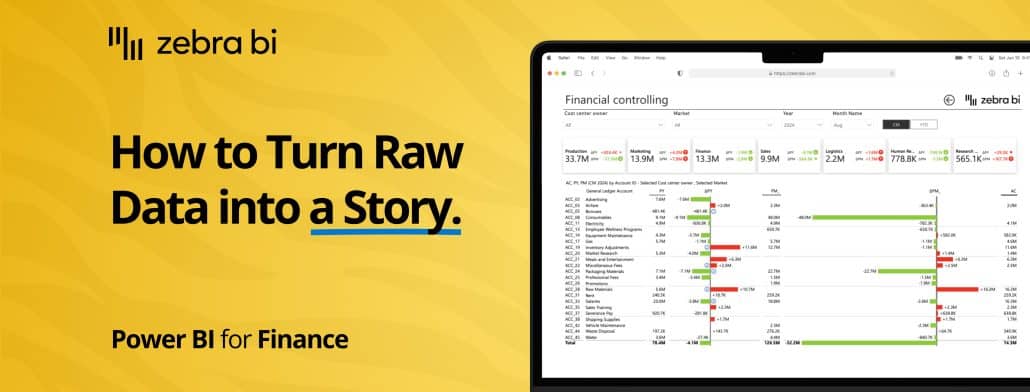
Your data should tell a story, and Power BI with Zebra BI can help you tell that story loud and clear. Here's what you need to know about Power BI storytelling.
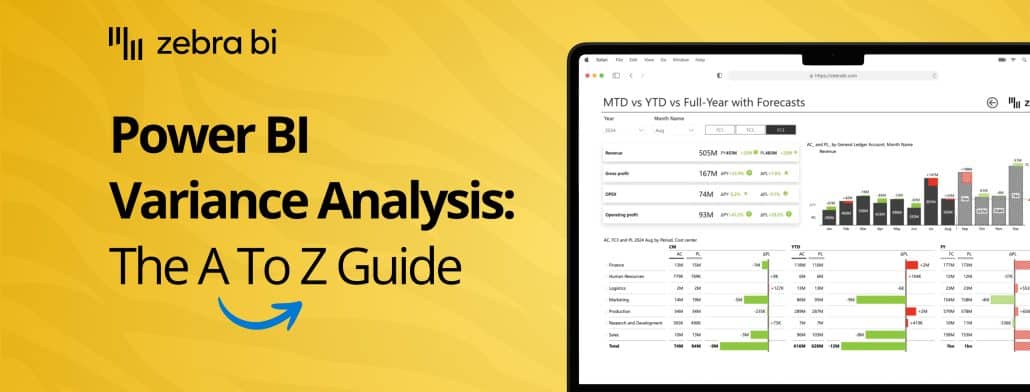
Ready to take your Power BI waterfall charts to the next level, the easiest way there is? Follow our guide for better custom visuals done in less time and with less hassle.
Traditional reporting is broken. The good news? You can future-proof your financial reporting (easily). Here's a quick webinar overview on this specific topic, click to learn more about modernizing financial reports, from our Senior BI Consultant, Mark.
Not sure where to start with your Power BI sales dashboard or how to optimize it? Here is a comprehensive guide that will help you make the most out of your sales data!
 September 8th
 February 22nd