Category: Metrics improved

July 23, 2026
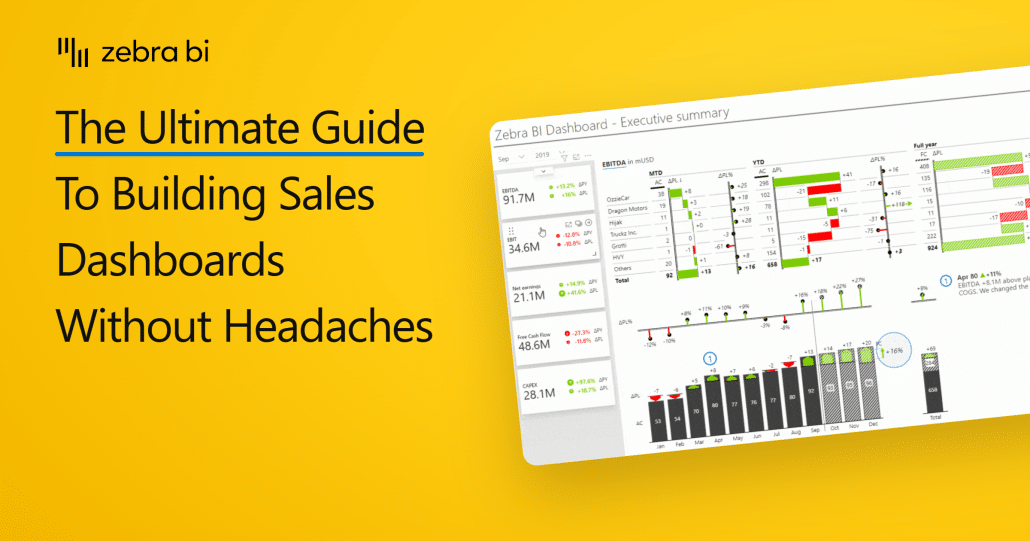
Power BI Sales Dashboards: How to Build, Design, and Optimize Your Reports
Not sure where to start with your Power BI sales dashboard or how to optimize it? Here is a comprehensive guide that will help you make the most out of your sales data!
Intermediate
May 29, 2025
Burndown Chart Excel Template
Download our Burndown chart and visualize your project plan and actual deliverables in a clean way that promotes data-driven decisions.
Intermediate
March 31, 2025
Cost Benefit Analysis Template
Our Cost Benefit Analysis Template helps you get all the important bits of information in one place, in an easy-to-understand way, to help you decide whether to proceed with a project or not.

Pagination

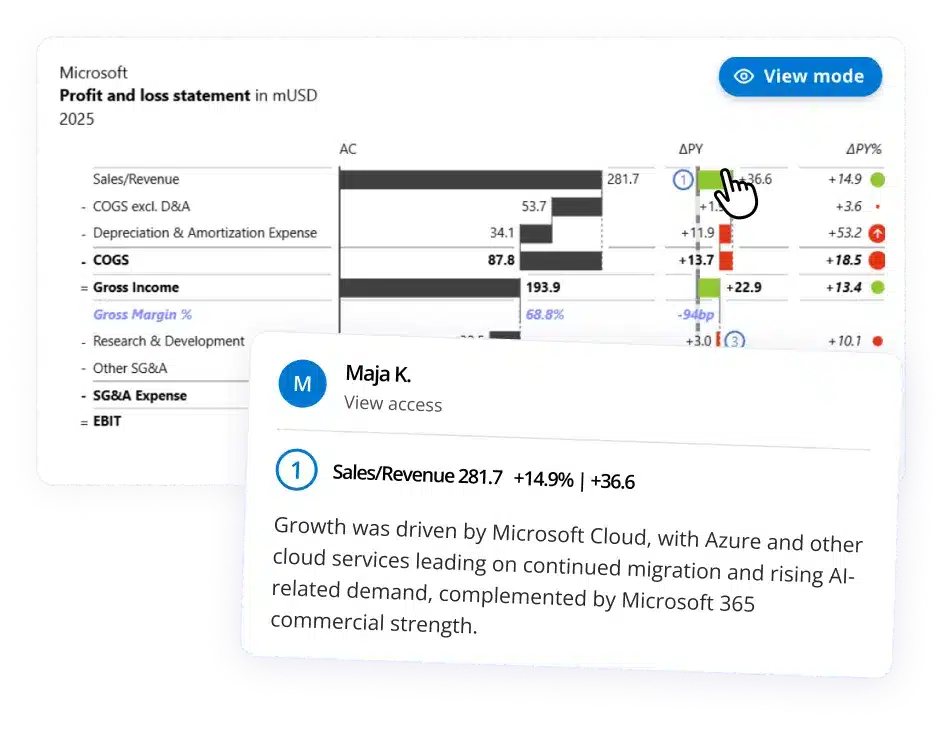
New: Zebra BI Tables+ and Charts+

Everyone can comment on the report. No edit rights needed.
See the new visuals
viewer commenting in zebra bi
Matija Prijatelj
BI Specialist