September 8th
 February 22nd
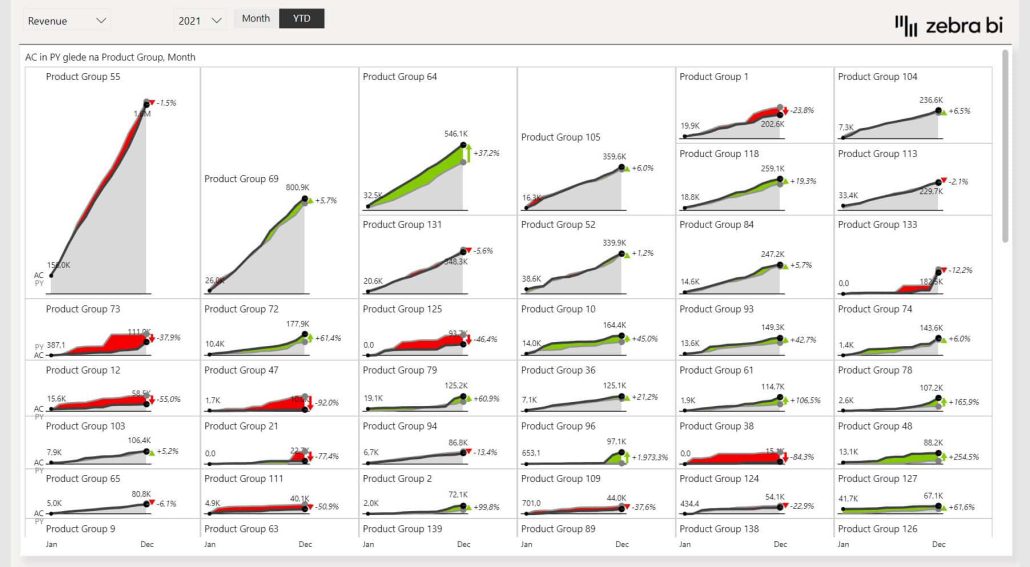
This is our reporting standard. We do not accept anything below it anymore.
Ipsen Pharma's five-person Business Excellence team rebuilt analytics across sales, marketing, medical, finance, market access, and leadership on Power BI with Zebra BI. The result: one reporting standard, faster market share diagnostics, and a Management Overview leadership opens every month.
Robert Anschütz has a story he likes to tell. A few years into his role as Business Excellence Lead at Ipsen Pharma's Munich office, his team had rolled out a new generation of dashboards, all built in Power BI with Zebra BI visuals on top.
He was crossing the cafeteria when a sales rep, a veteran close to retirement, stopped him. The dashboards were great, the rep said. He could finally do, in seconds, things he had always wished he could do.
For a 5-person team responsible for analytics across a global pharma company active in oncology, rare diseases, and neurology, that minute mattered.
Ipsen had adopted Power BI as its reporting standard years earlier, but adoption had remained low. Every department had its own dashboards, its own colors, its own shorthand for the same numbers.
The deeper issue was structural. Reports forced a tradeoff nobody at Ipsen was willing to live with:
If I sat in a marketing meeting, I would see a different dashboard than when I sat in a leadership meeting. Different colors, different ways of showing data.
Robert had been wrestling with a dataset from a third-party provider. He sketched out how he wanted it visualized, sent the screenshots to his Power BI Reporting Manager, and waited. The reply was short.
"Yes, thank you, but let me show you something."
What came back was a Zebra BI dashboard built on Robert's data, with every KPI he had asked for at a glance and the granularity sitting one click away.
I was intrigued the moment I saw it. It finally gave me everything I needed.
Within months, Zebra BI had moved from one analyst's screen to every report the team built. From there it spread outwards across six functions:
Training rolled out by function. The data-savvy teams got the full toolkit. Top management got a leaner version with the KPIs they used and a path to dig deeper when they wanted to.
Now this is a standard across the company. You always know how your sales developed, how your market share developed. Everybody looks at the same thing.
The clearest proof of the shift shows up when something goes wrong. A market share number drops. Where is it coming from?
Before Zebra BI, the answer used to stop at the national level. The gap was visible, the cause was not.
Now, Robert opens the same dashboard and walks the question down:
Within seconds, we can pinpoint where we're losing. Within minutes we know what to do.
The crown jewel of the rollout is something Robert's team calls the Management Overview. Four monthly reports, all built on Zebra BI:
There's nothing worse than creating a Power BI dashboard just for yourself. You want others to make use of it. That's what we achieved.
Asked about ROI, Robert will not give you a hard number. What he will tell you is that the math on his team has changed. Executives who used to route every question through his analysts now find their own answers with self-serve analytics. His team has been freed up to focus on the questions only they can answer.
And in rare disease, the return goes beyond time saved. In a rare disease, every patient really counts. If we have a way to better analyze the data and generate insights, that means patients get life-improving treatments at an earlier point in time. That's basically the motivation for our daily work.
Zebra BI brings the best of both worlds. The top-level view, the most important KPIs at a glance, and at the same time the full granularity of the data. It's intuitive. It's easy to understand. People understand what the values actually mean and how they've developed over time.
Top-level overview and full granularity. Now the company-wide standard at Ipsen Pharma.
Turn Power BI into a company-wide reporting standard like Ipsen Pharma