Get Actionable Insights from your data in Power BI

Zebra BI combines the most intuitive visualization tools to take your Power BI reports to the next level and deliver insight from your data in record time.
Try Zebra BI on your data

Create advanced reports in a single visual

One visual, many visualizations. With Zebra BI you can build any report you want, from sales dashboards to complex financial statements. Right in your Power BI. 

Format almost every aspect of your tables, charts and cards within one visual and simply slide between all the advanced charts you'll ever need in your business reports and dashboards.

Calculate comparisons 
out-of-the-box

Compare your data to something and put it into perspective. Variances are the holy grail of reporting because they help you understand performance in the right way. 

Zebra BI's utterly flexible and intuitive business charts, tables and cards automatically calculate absolute and relative variances for you!

Adapt information density with responsive layout 

Zebra BI visuals for Power BI are the world's first fully responsive visualizations. The visuals will automatically adapt the amount of information presented to fit the available space.

Widely accepted quality standards

+ 46%
Increase in speed of analysis*
+61%
Improvement in decision accuracy*
4.8
user rating in Microsoft AppSource
*Based on eye-tracking and qualitative study by Technical University in Munich, Germany

Supercharge reports with advanced Small Multiples

Create multiple charts to compare various data categories and discover insights in just a few clicks. All charts perfectly scaled.

Zebra BI visuals contain the most advanced algorithms for rendering small multiples among BI software so far.

Integrate comments for better storytelling

With Zebra BI adding comments to your reports has never been easier. 

Use dynamic Comment markers for comments to appear in the tooltip when you hover over them. You can also use a comment box to display dynamic comments next to your tables in Power BI reports and dashboards. 

Right inside the visual!

Use enhanced report page tooltips for deeper insights

Zebra BI report page tooltips can deliver much more details and insights than native Power BI tooltips as they can show additional dimensions that aren't even part of the visual.

With the Top N + Others functionality you can even limit the number of categories that are displayed and highlight only those with the greatest impact on your business.

Calculate new measures on the fly with Formula Editor

Goodbye complex data set changes, hello custom calculations within Zebra BI!

Whenever you want to add a new element to your table and it's not in your data set, you can simply calculate it with a Formula Editor within a Zebra BI visual. That’s how you can add completely new elements to your tables, without doing any work on your data set.
How it works in tables

Switch between visualization elements

Zebra BI offers everything you need to visualize your data in the best way: from Stacked charts and Combo charts, to Segmented charts, Waterfall chart with subtotals, Single measure Waterfall chart, Drop lines, and much more.
Learn more about Charts

Add multiple KPIs within one visual!

With Zebra BI Cards, you will transform the way of representing your Key Performance Indicators or your scorecard.

Speed up the rendering and loading time of your reports significantly by adding as many KPIs as you need in one visual. Create a comprehensive entry page of your dashboard and use drill-through to access more detailed report pages with Charts and Tables!
Explore Cards
visual styling zebra bi power bi

Style your dashboards for best clarity

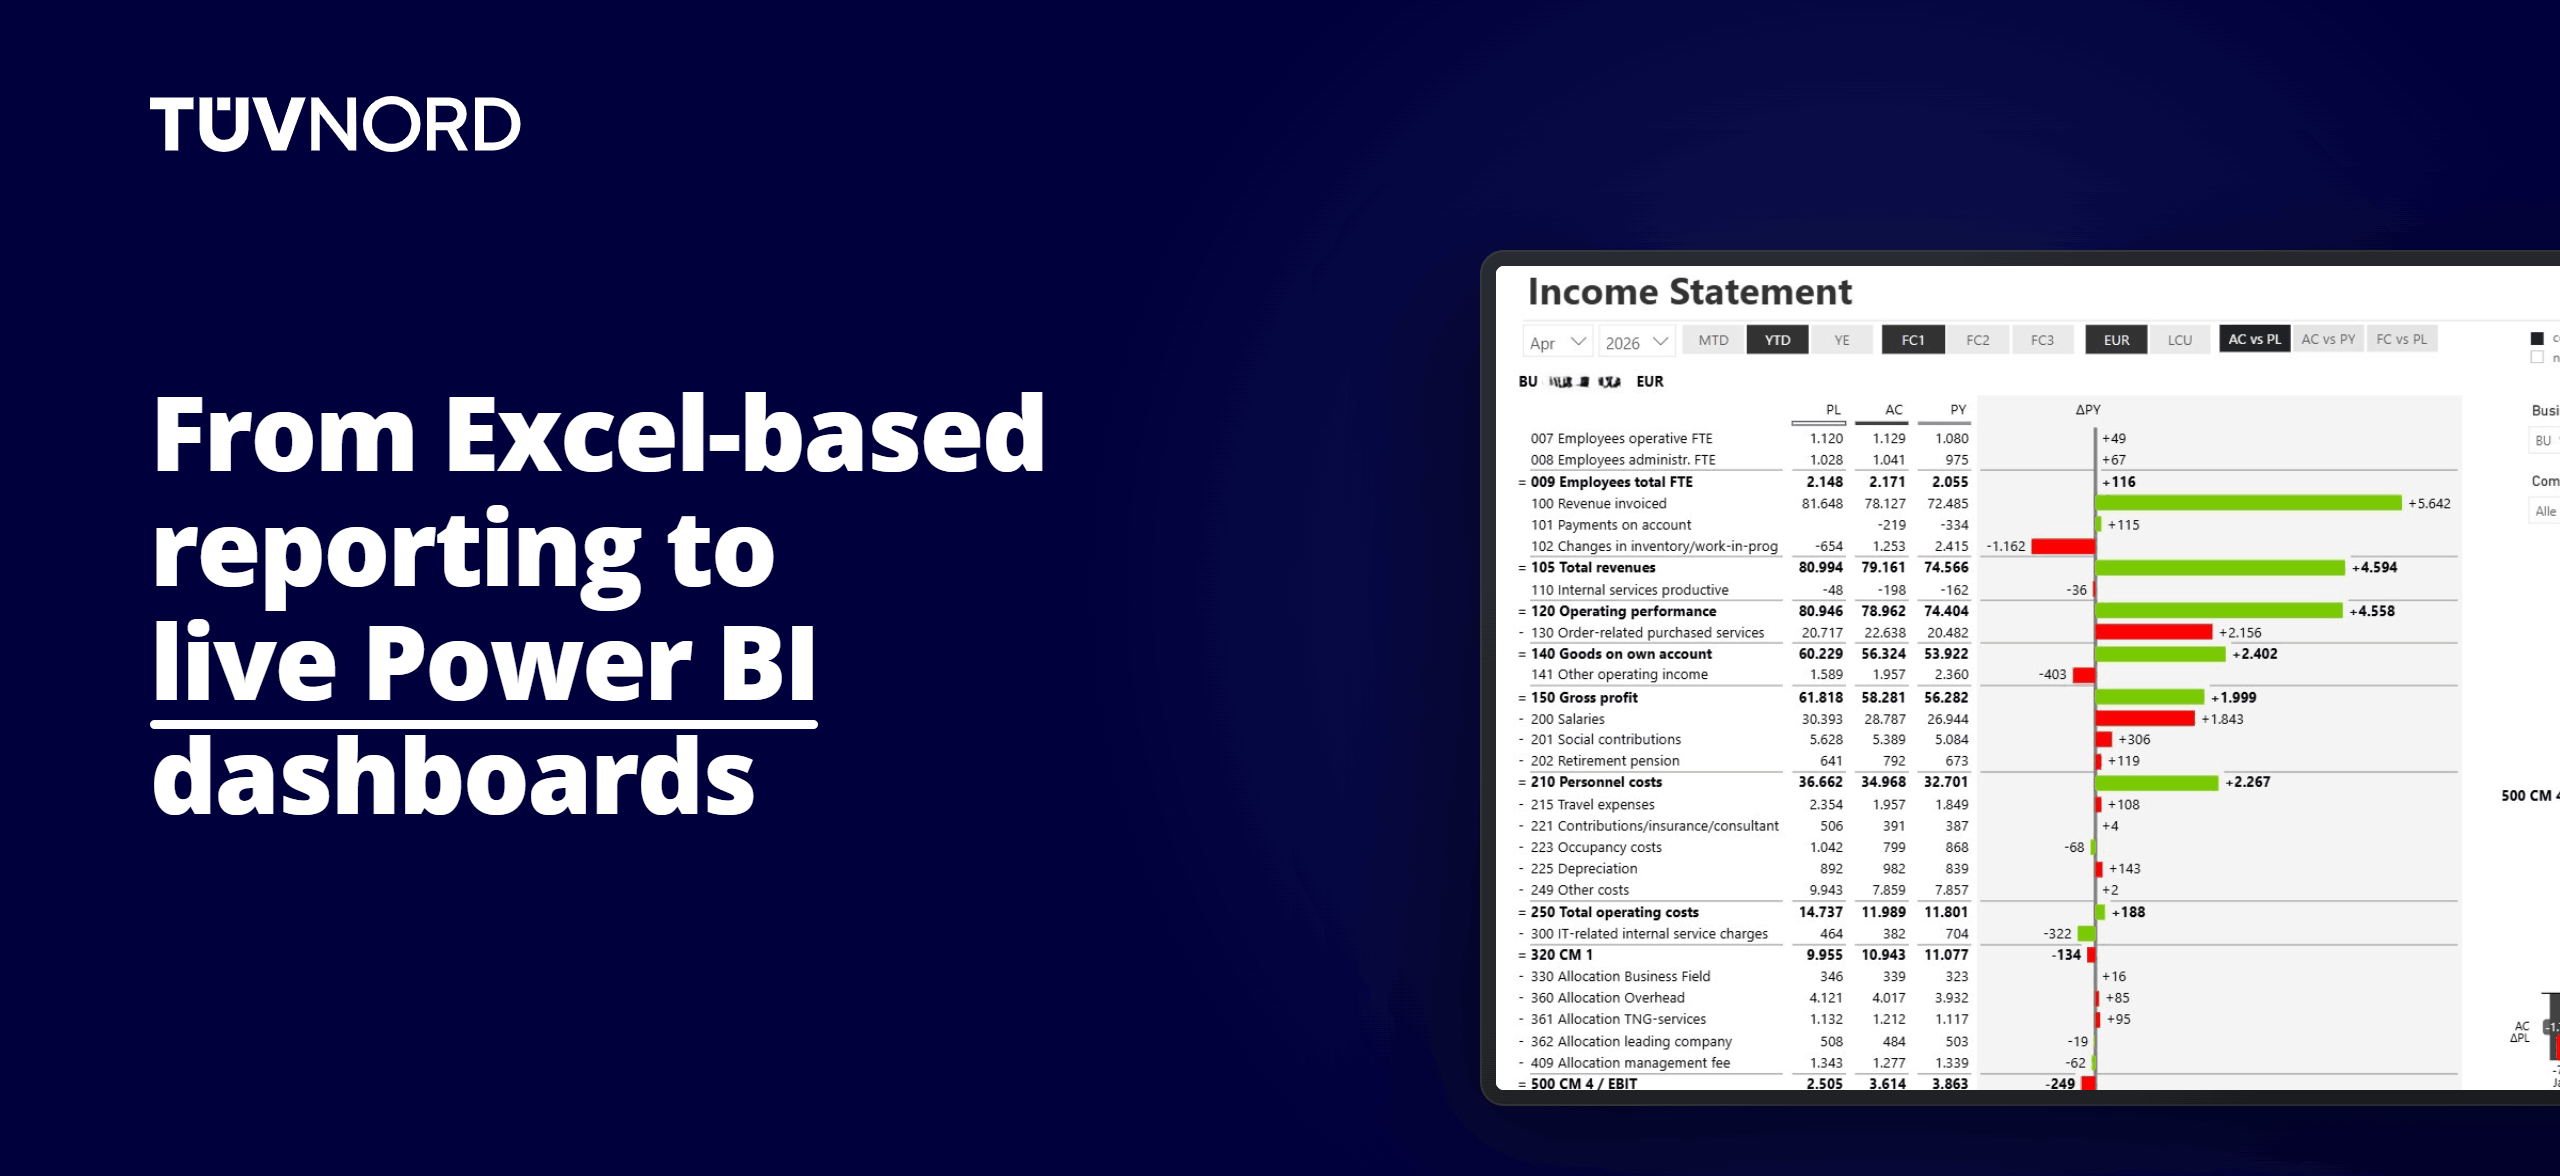
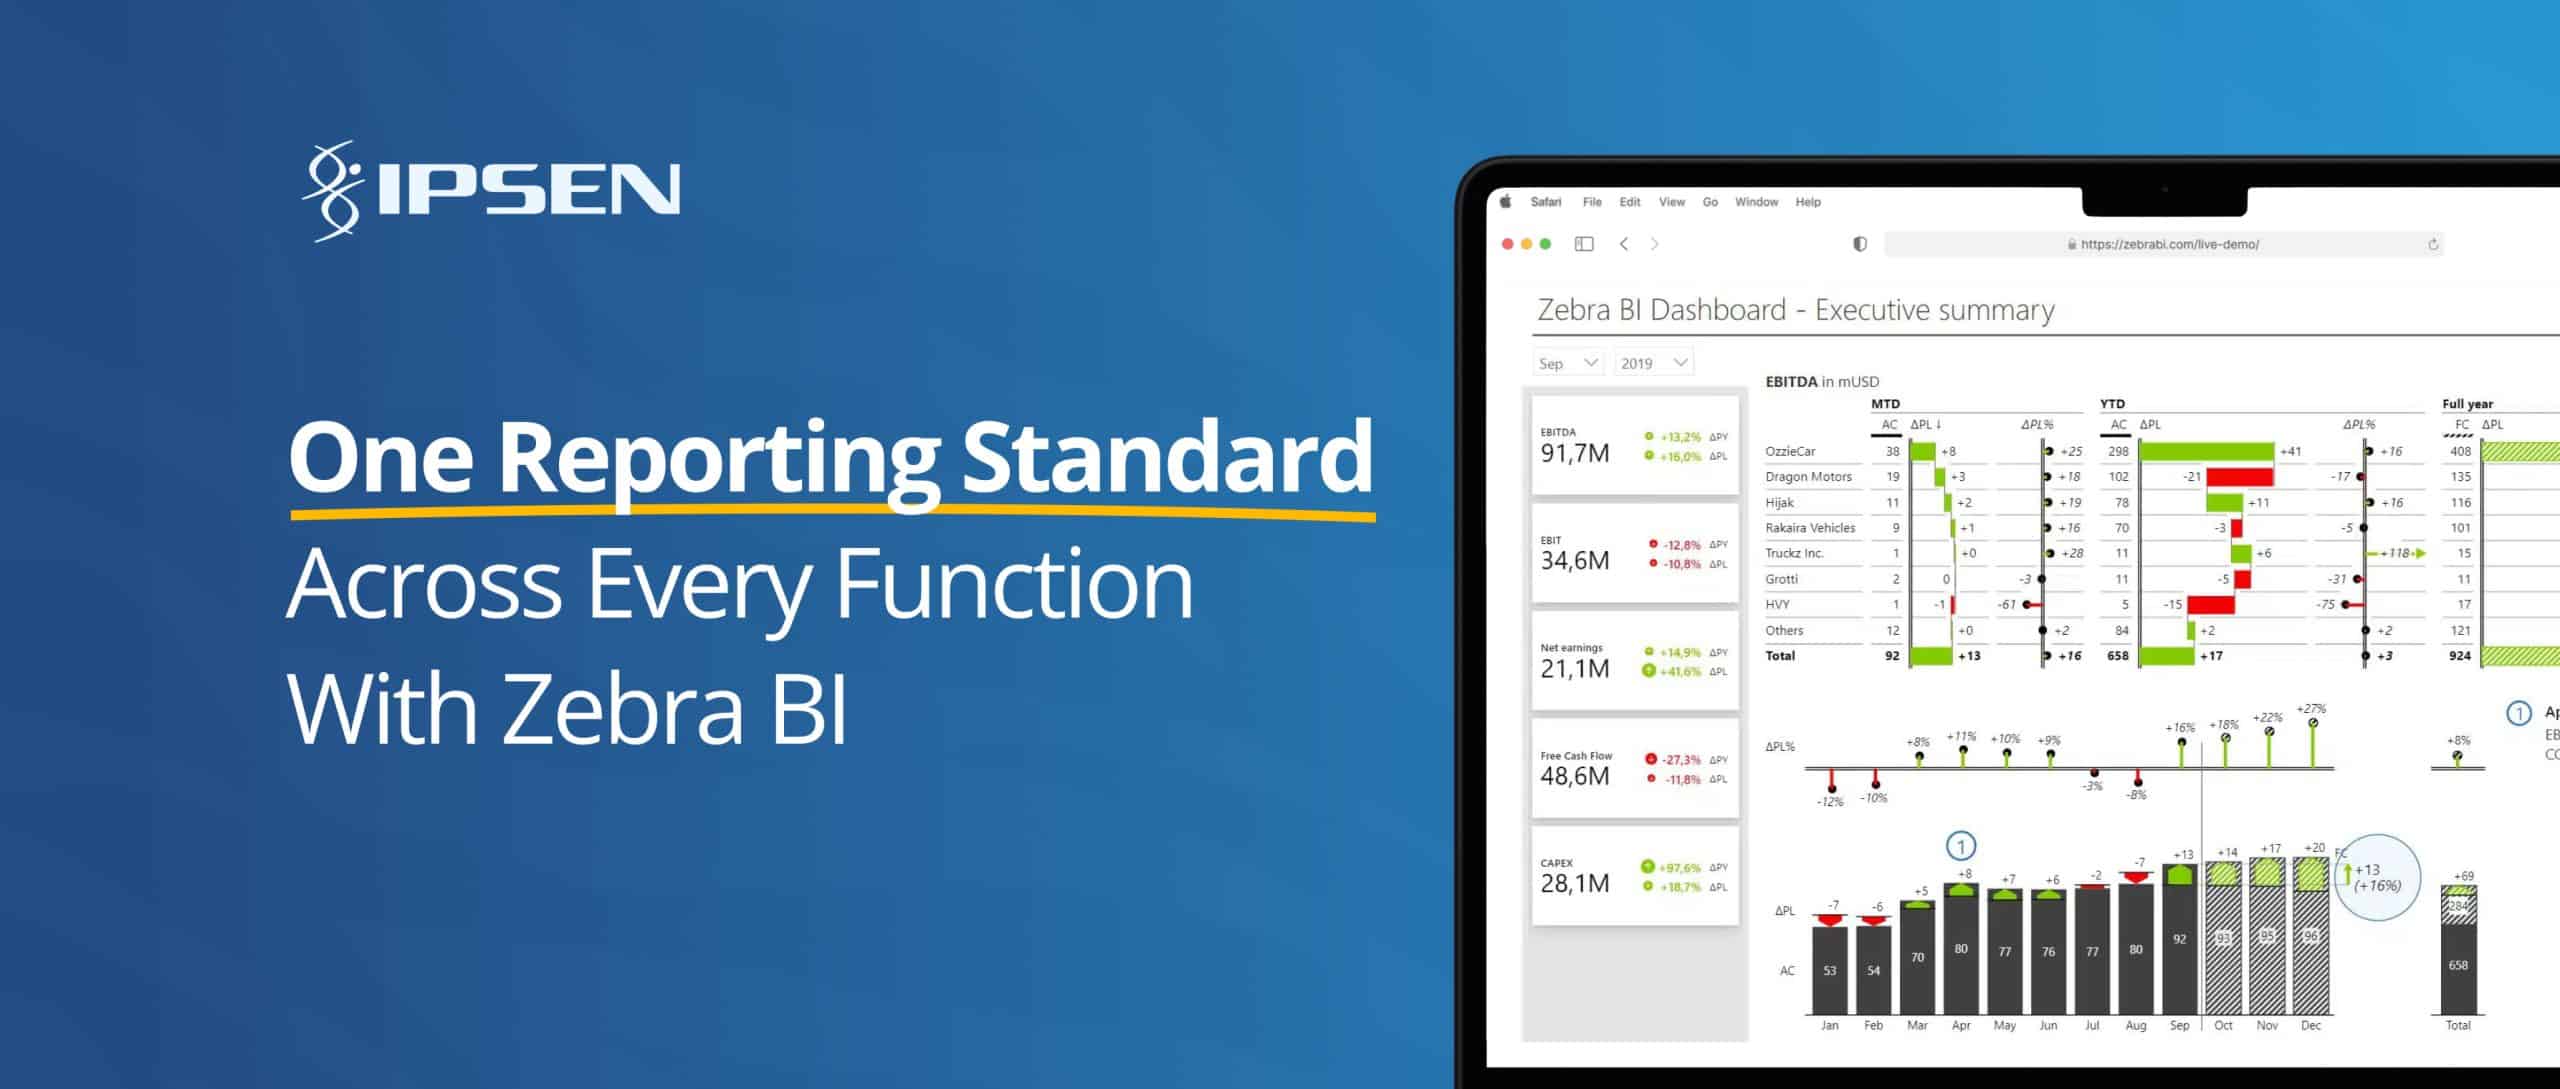
Use endless possibilities to design stunning reports and dashboards that work best for your business. From advanced highlighting to standardizing specific elements such as labels or even the design of all reports across the company with custom themes.

All compliant with IBCS reporting standards.

March 28, 2024

Live Zebra BI Power BI Demo

Register Now

So amazing, even Microsoft uses it for internal reporting.

MORE THAN 1.500,000 EXPERTS USE OUR PRODUCT DAILY

What our customers say

Stunning Financial Statements - Live Demo

With Zebra BI you can also create user-friendly income statements, balance sheet, and cashflow reports in Power BI! With subtotals, invert function for costs, reorderable columns, automatic variance charts and much more.
Explore templates library

Zebra BI Visuals are #1 Reviewed Add-In For Financial and Sales Dashboards. 

4.9

Used by thousands of business analysts around the world. Get Zebra BI Charts, Tables and Cards directly from the Microsoft AppSource.

Learn how we help our customers solve real challenges

August 29, 2023
5 practical tips from AbbVie on driving internal report adoption
Driving internal adoption of new reporting tools is not easy. Get practical tips from AbbVie's Senior Financial Data Analyst on how to succeed in this process.
Read the success story
August 24, 2023
How PwC team used wireframes & report prototypes to answer the right business questions
Learn about PwC's experience of standardizing report across different departments and territories with the help of report prototypes & wireframes.
Read the success story
August 9, 2023
How Bayer Finance 360 App became a one-stop shop for immediate insights
Read about the implementation of Bayer Finance 360 App that became a one-stop shop of business-critical insights for their CFO, managers, and data analysts.
Read the success story
Read all customer stories
START FOR FREE

Ready to see Zebra BI visuals in action?

Import Zebra BI to your Power BI and see the magic on your data! You can also contact us to help you build your first test report and create a custom package for your business.