Power BI: How to Insert Row Numbers in Table Visual
PRO Trial
Inserting row numbers in Power BI table visual is a powerful feature that data analysts and businesses globally leverage for efficient data visualization. These row numbers are fundamental in data analysis, facilitating easy identification of specific rows and monitoring their changes. This article delves into the step-by-step process of adding row numbers to your Power BI table visuals.
The Importance of Row Numbers in Table Visuals
Table visuals are an essential part of data analysis in Power BI. They help in representing numerical data in an easy-to-understand format. However, keeping track of individual rows without row numbers can be challenging. With row numbers, you can quickly identify specific rows and track their movement as you filter, sort, or search data within the table.
Another advantage of row numbers in table visuals is that they make comparing data across different rows easier. For instance, if you have a table that shows sales data for other products, you can quickly identify which product has the highest or lowest sales by looking at the row numbers. This can help you decide which products to focus on or to discontinue.
Furthermore, row numbers can also be helpful when referencing specific rows in your analysis or reports. Instead of describing the row using other attributes, such as the data values or column headers, you can refer to the row number. This can save time and reduce the chances of errors in your analysis or reporting.
Get Actionable Insights from your data in Power BI
Zebra BI combines the most intuitive visualization tools to take your Power BI reports to the next level and deliver insight from your data in record time.
Step-by-Step Guide to Adding Row Numbers in Power BI
For those who prefer a simple, step-by-step guide, here are the instructions to add row numbers to your Power BI table visual:
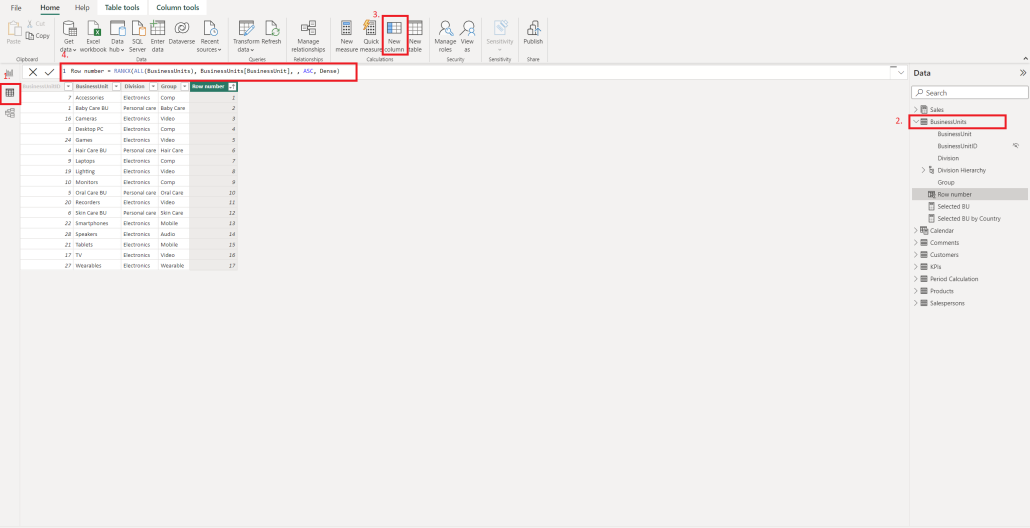
- Open your Power BI desktop and select the table where you want to add row numbers in Data View.
- Navigate to the Home Tab and click on the New Column button
- This will open up a formula bar at the top of the screen. You can type your new column name here, such as "Row Number."
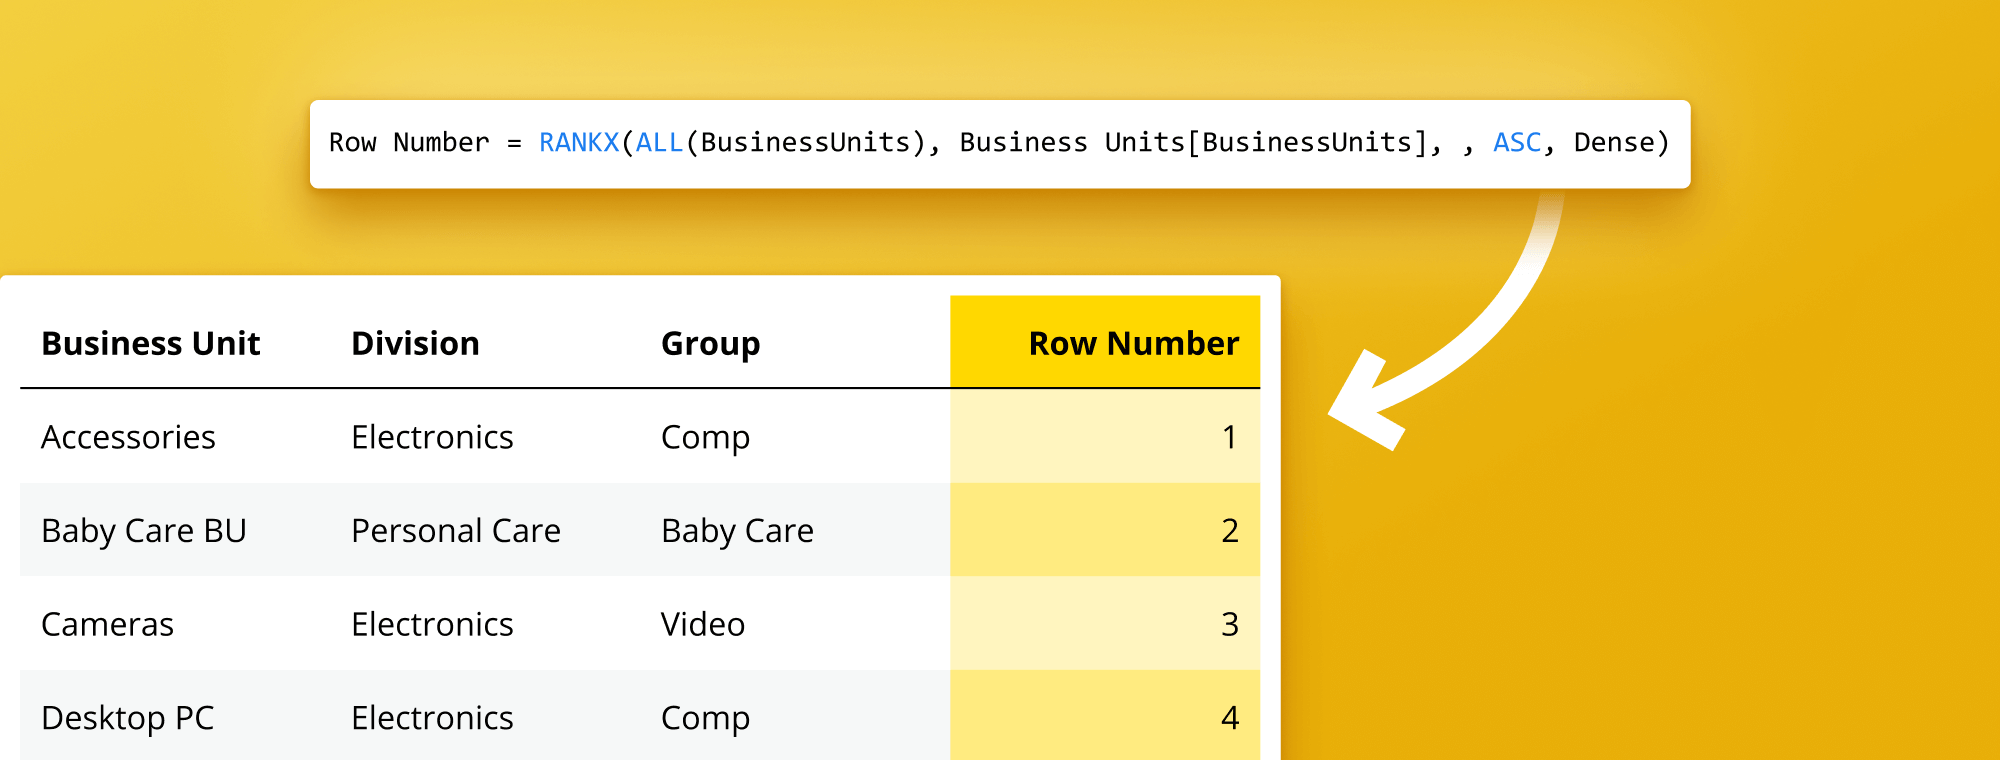
- After typing the column name, type in the following formula:
= RANKX(ALL(Table), Table[Column], , ASC, Dense)whereTableis your table name, andColumnis the specific column you are ranking. - Press Enter. Power BI will automatically calculate the row numbers for your table.
Adding row numbers to your Power BI table visual can be a helpful way to keep track of the order of your data. This feature is beneficial when working with large datasets or when you need to sort your data in a specific way. By following the steps outlined above, you can easily add row numbers to your table visual and improve the readability of your data.
Top Benefits of Using Row Numbers in Power BI Table Visuals
The numerous benefits of adding row numbers to a Power BI table visual. First, it helps track individual rows, making sorting, filtering, or searching your data more accessible. Additionally, row numbers can help identify specific data points and highlight anomalies in your data, bringing new insights into your analysis.
Another benefit of using row numbers in Power BI table visuals is that it can help identify duplicates or missing data. A unique identifier for each row allows you to spot duplicates or missing values in your data set easily. This can save you time and effort in cleaning and preparing your data for analysis.
Furthermore, row numbers can help create custom calculations or measures in Power BI. For example, you can use row numbers to calculate the percentage change between two rows or to create a running total of a specific column. This can provide a more comprehensive view of your data and help make informed business decisions.
Adding to the versatility of row numbers in Power BI, they also come into play when using advanced visualization tools such as Zebra BI Tables. With the help of an index column (row numbers), you can gain more control over the sorting of categories. This feature is especially beneficial when the default sorting mechanism does not yield the desired visual representation.
When preparing data for a Zebra BI Waterfall chart, an index column enables users to manually sort the categories in a way that provides the most intuitive and insightful view of the data. A visual tool's utility is vastly enhanced when you can present data to best suit your specific analytical needs and business context. To leverage this, users can follow the guide on "How to manually add a sorting column" and utilize the full potential of their Zebra BI visuals.
Whether you're trying to highlight trends, reveal anomalies, or make the data more accessible and meaningful, incorporating row numbers can drastically improve the effectiveness of your data analysis and visual representation in Power BI and Zebra BI. It's another layer of precision that enhances how data is managed, manipulated, and understood, ultimately facilitating more informed business decision-making.
How to Customize Row Numbers in Your Power BI Table Visuals
The primary row number format provided by Power BI is simple and functional. However, you can customize it to fit your needs during the data preparation stage. For example, you can change the row numbers' format by manipulating them as text.
One way to customize your row numbers in Power BI is by adding prefixes or suffixes. This can be useful when you want to add context to your data. For instance, you can add a prefix such as "Rank" to your row numbers to indicate that they represent the ranking of your data. You would typically do this in the Power Query Editor or via DAX in a calculated column to add a prefix or suffix to your row numbers.
For instance, a simple DAX formula to add a "Rank" prefix could be:
Row Number = "Rank " & RANKX(ALL(Table), Table[Column], , ASC, Dense)
Remember, formatting changes like this are done in the data modeling phase of Power BI, not in the table visual settings. Once the row numbers are created and formatted as you desire, they will be displayed in the graphic.
Troubleshooting Common Issues When Inserting Row Numbers in Power BI
While adding row numbers in Power BI is generally straightforward, you might encounter specific challenges that can impact your data visualization.
A potential performance issue may arise when dealing with a large dataset. Adding row numbers with a calculated column may slow your report's performance. To mitigate this, consider using a measure that ranks rows on the fly in the visual context. However, remember that actions behave differently and might not persist in the rank when filtering or slicing the data.
Misalignment or overlapping row numbers with other data points within your visualization should not typically be an issue if you're creating row numbers as a new column because each cell in the table should contain only the respective row number.
Tips and Tricks for Using Row Numbers Effectively in Power BI Tables
Here are some tips and tricks to ensure that you use row numbers effectively in your Power BI tables:
- Keep Consistency: Ensure that the row numbers are consistent across all tables in your report. This will help users navigate and compare data between different tables.
- Apply Meaningful Numbering: Consider using a numbering system that's meaningful and relevant to your data, such as alphabetical or chronological order. This will make it easier for users to understand and interpret the information presented in your tables.
- Use Row Numbers for Filtering: Use row numbers to filter out specific rows, especially in large tables. For example, you can show only the top or bottom ten rows based on specific metrics.
- Combine with Other Features: Make full use of other Power BI features. For instance, you can use conditional formatting to highlight rows that meet certain criteria. This can help direct attention to important data points.
Remember, row numbers can be very useful for tracing the logic of your analysis, especially when dealing with complex tables or large data sets. It's crucial to create and use them wisely to maximize their benefits.
Advanced Techniques for Displaying Row Numbers in Power BI
Power BI offers several advanced techniques to enhance the use of row numbers in your tables.
- Conditional Formatting: While you can't conditionally format the row numbers themselves, you can use conditional formatting to highlight specific data points in other columns of your table. This can draw attention to important data and make cross-reference with your row numbers easy.
- Use of DAX Formulas: The
RANKXfunction is a powerful DAX formula that allows you to create a dynamic row numbering system based on a specific column. This function can rank your data, effectively creating row numbers that adjust based on the context of your visuals, and is particularly useful when you need to highlight top or bottom values in a table. - Creating Row Number Variations: You can also make variations of row numbers with DAX. For example, you might create a calculated column that combines row numbers with another category, effectively creating a nested ranking system.
How to Export and Share Your Power BI Table Visuals With Row Numbers Included
Once you've added row numbers to your Power BI table visuals, it's a relatively simple process to export and share them. If the row numbers have been added as a calculated column in your data model, they will be included in your exported data. To export your visual, click on the ellipsis (...) in the upper-right corner of your graphic and select "Export Data." From there, you can choose your preferred data format for export.
Remember, adding row numbers to your Power BI table visuals can significantly improve your data analysis by providing a straightforward way to track individual rows and pinpoint specific data points. You can customize your row numbering system using the various techniques offered by Power BI to align with your particular needs.
Row numbers also aid in data validation. Having a unique identifier for each row can streamline the process of checking for missing or duplicate data, saving time and minimizing errors in your analysis.
Moreover, you can leverage row numbers to sort and filter your data. Sorting your table by row number lets you observe data in a specific sequence. Filtering by row number lets you focus on particular data ranges, a precious capability when dealing with substantial datasets.
Conclusion
In conclusion, inserting row numbers into Power BI table visuals provides many benefits, from easier data tracking to insightful custom calculations. This technique also extends its utility to Zebra BI visuals for Power BI.
Zebra BI Tables, a robust tool that enhances your Power BI experience, integrates seamlessly with this feature. This allows for efficient filtering and sorting of data. Whether conducting comprehensive data analysis or creating interactive dashboards, using row numbers with Zebra BI Tables can significantly boost your analytical capabilities. This can help you derive meaningful insights from your data.
You can improve your data manipulation skills by understanding and implementing these features. This will pave the way for more informed business decision-making and superior data storytelling. Remember, data analysis lies not only in the data itself but also in how you present it.
Enhance Your Power BI Reports with Zebra BI
Integrate Zebra BI with Power BI for superior visualizations, transforming your data into accessible, insightful information within clicks.