5 Essential Steps on How to Count Rows in Power BI: A Comprehensive Guide
PRO Trial
Want to learn how to count rows in Power BI? Counting rows easily may seem simple, but it can be important for understanding and analyzing your data effectively. In this guide, we'll go over everything you need to know about counting rows in Power BI, including why it's important, the different ways to count rows, a step-by-step guide on how to count rows using the 'Count Rows' function, and DAX expressions, using measures and visuals to count rows, best practices, troubleshooting common issues, and advanced techniques.
If you meant to count your rows by:
- Applying index column follow this guide: How to Add Index Column in Power BI Dax or,
- Inserting row numbers in your dataset, follow this guide: Power BI: How to Insert Row Numbers in Table Visual
Why Counting Rows in Power BI is Important?
Counting rows in Power BI is essential because it helps you keep track of the size and complexity of your data sets. By understanding how many rows are in your data set, you can better understand the relationships between different data points, identify patterns, and make more informed business decisions. Knowing the number of rows can also be critical for performance optimization and troubleshooting common issues.
Another reason why counting rows in Power BI is essential: it can help you identify data quality issues. For example, if you notice a sudden increase or decrease in the number of rows, it could indicate missing or duplicate records in your data set. By identifying these issues early on, you can take steps to clean and improve your data, leading to more accurate insights and better decision-making.
Finally, counting rows in Power BI can also help you manage your data storage and processing costs—many cloud-based data storage and processing services charge based on the amount of data you store or process. By knowing the number of rows in your data set, you can estimate the storage and processing costs and make informed decisions about optimizing your data usage and minimizing costs.
Try Zebra BI custom visuals for Power BI
Zebra BI will take your Power BI reports to the next level in just a few clicks, delivering insight from your data in record time.
The Different Ways to Count Rows in Power BI
There are several ways to count rows in Power BI, including using the Count Rows function, DAX expressions, measures, and visuals. Each method has benefits and limitations, depending on your specific use case and data set.
The 'Count Rows' function is a simple way to count the number of rows in a table or a selected column. It is a quick and easy method, especially for beginners just starting to work with Power BI. However, it may not be the most efficient method for large data sets, as it can slow down the performance of your report.
DAX expressions and measures are more advanced methods for counting rows in Power BI. They allow you to create custom calculations and perform more complex operations on your data. These methods are instrumental when counting rows based on specific conditions or criteria. However, they require a deeper understanding of Power BI and may take longer to set up and implement.
Step-by-Step Guide: Counting Rows in Power BI using the 'Count Rows' Function
The 'Count Rows' function is one of the most straightforward ways to count rows in Power BI. Here's a step-by-step guide on how to use it:
1. Open Power BI and load your data set
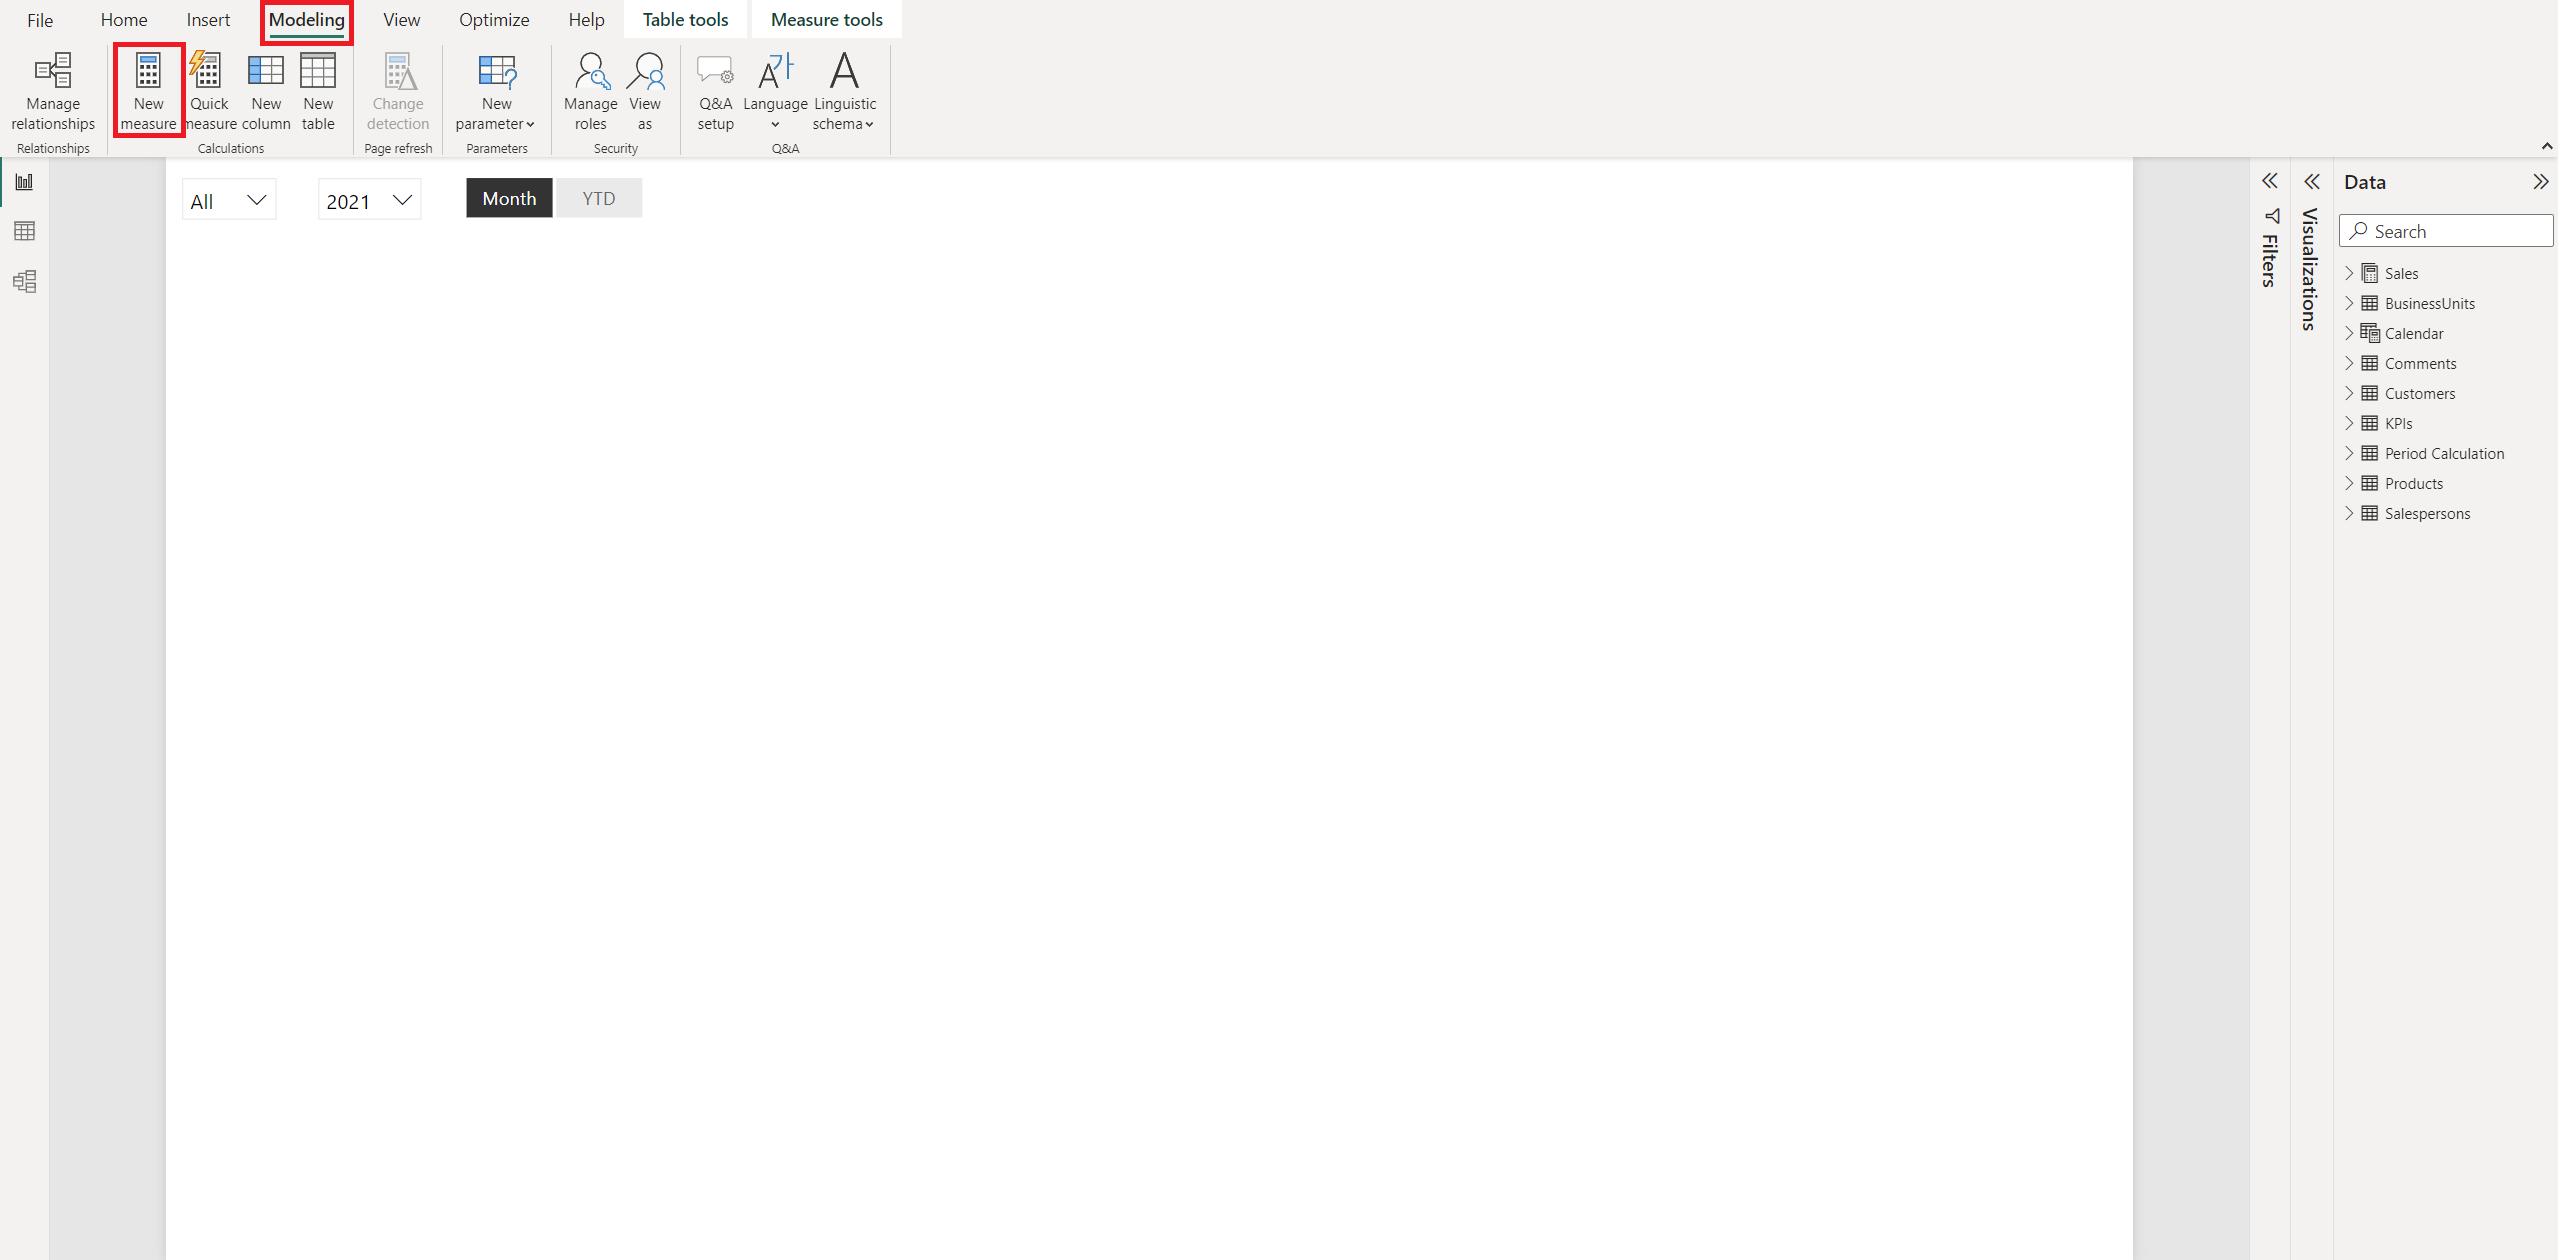
2. Click on the 'Modeling' tab, and then click on the 'New Measure' button
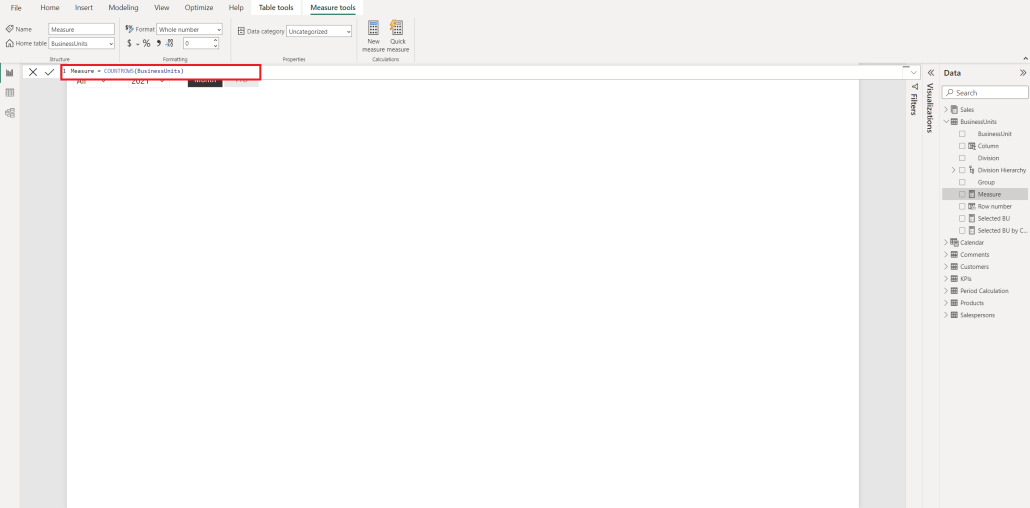
3. Enter the following formula into the formula bar: COUNTROWS(Table)

4. Replace 'Table' with the name of the table you want to count rows for
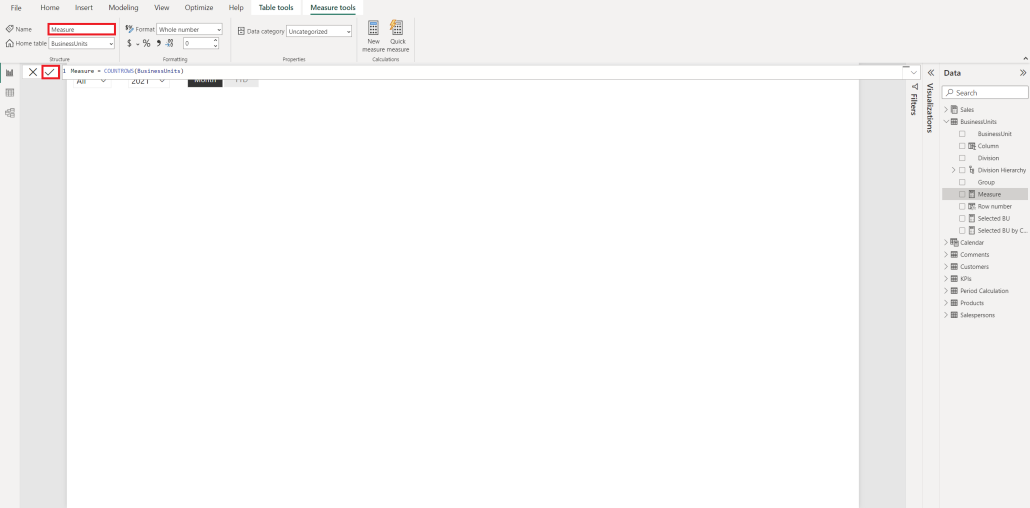
5. Name your new measure, and then click on the 'Check' button to validate the formula
Once you have created your new measure, you can use it in your visualizations to display the number of rows in your table. This can be particularly useful when you want to quickly check the size of your data set or compare the number of rows between different tables.
It's worth noting that the 'Count Rows' function only counts the number of rows in a table and does not consider any filters or slicers that may be applied to your data.
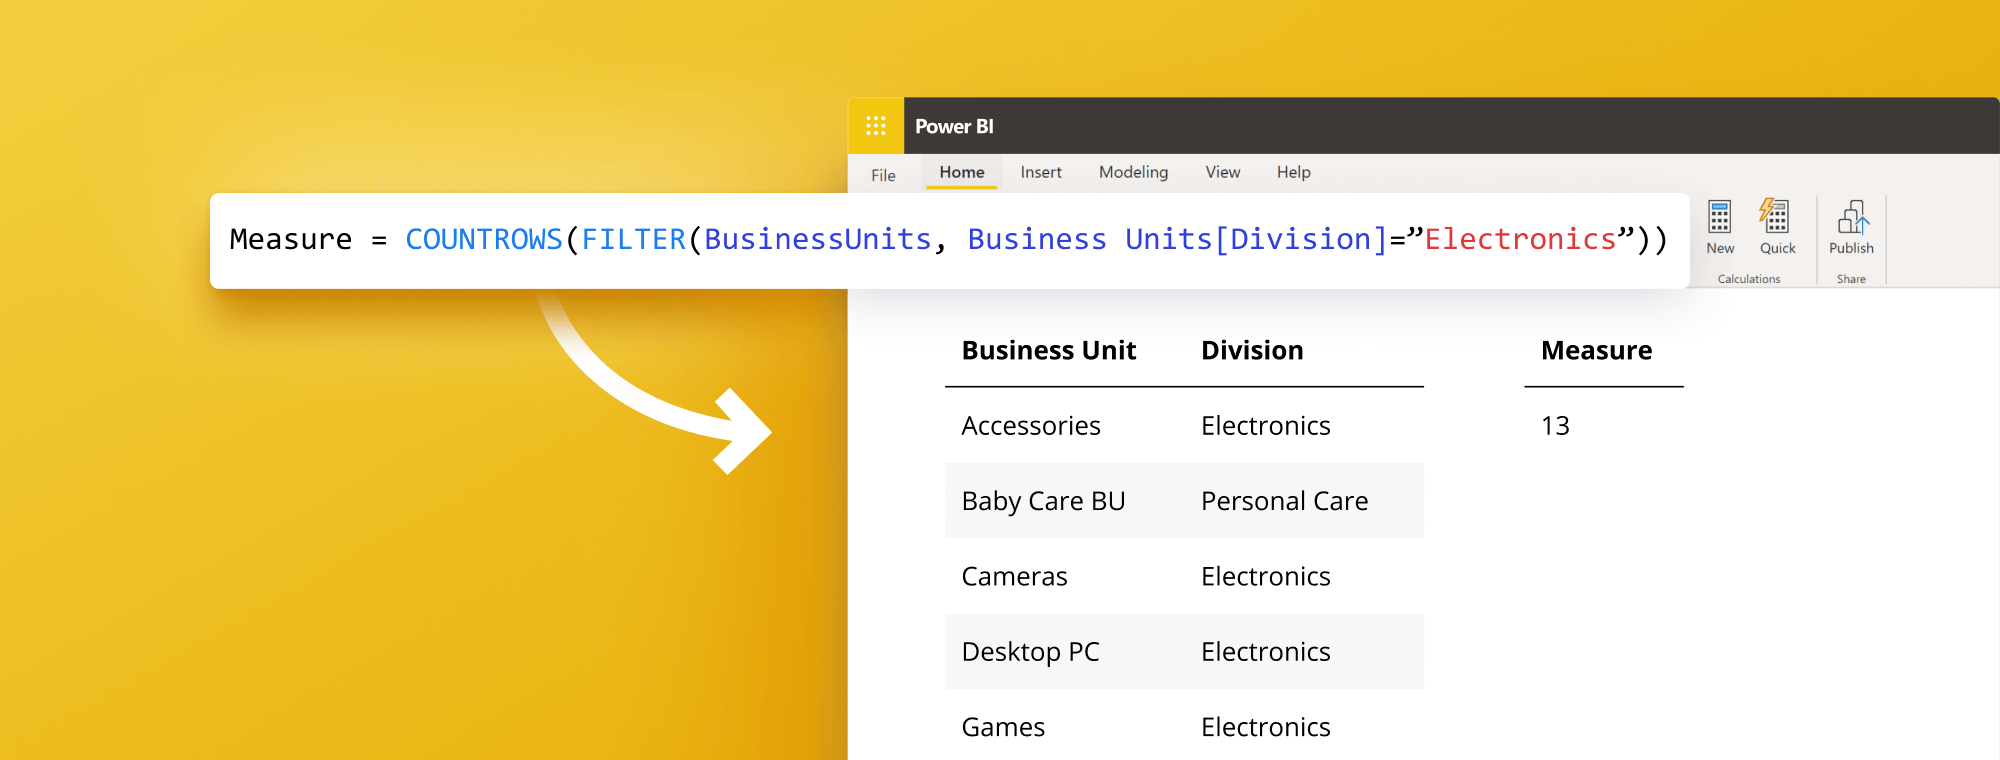
How to Count Rows in Power BI using DAX Expressions
DAX expressions are a more powerful way to count rows in Power BI, as they allow you to do more complex calculations and incorporate other metrics into your analysis. Here's how to use DAX expressions to count rows:
- Open Power BI and load your data set
- Click on the 'Modeling' tab, and then click on the 'New Measure' button
- Enter the following formula into the formula bar:
COUNTROWS(FILTER(Table, Condition)) - Replace 'Table' with the name of the table you want to count rows for
- Replace 'Condition' with any additional filters or criteria you wish to incorporate into your analysis
- Name your new measure, and then click on the 'Check' button to validate the formula
Additionally, DAX expressions can count rows based on multiple conditions. You can use the 'AND' or 'OR' operators within the 'FILTER' function to specify various conditions. For example, the formula could look like COUNTROWS(FILTER(Table, Condition1 && Condition2 || Condition3)).
Using Measures to Count Rows in Power BI
Measures are calculated values that allow you to analyze your data more deeply, including counting rows.
Measures can be used for more than just counting rows. They can also calculate averages, sums, and other mathematical functions. This lets you gain deeper insights into your data and make more informed decisions.
It's important to note that measures are dynamic and will update automatically as your data changes. This means that you don't have to manually update your calculations every time new data is added to your data set.
How to Use Visuals to Count Rows in Power BI
Visuals are an easy way to see how many rows are in your data set visually. Here's how to use visuals to count rows:
- Open Power BI and load your data set
- Select the table you want to count rows for in the 'Data' pane on the right-hand side of the screen.
- Drag and drop the 'Table' field onto a visual, such as a Table or Matrix
- The visual will automatically show all the rows in your data set
Using visuals to count rows is not only a quick and easy way to get an overview of your data set but can also help you identify potential issues or errors. For example, if the number of rows in your visual doesn't match the number of rows in your original data set, it could indicate duplicates or missing values that need to be addressed.
Additionally, you can customize your visuals to display row counts differently. For instance, you can add filters to your visual to only show rows that meet specific criteria or use conditional formatting to highlight rows that satisfy particular conditions. These features can help you gain even more insights into your data set and make it easier to identify trends and patterns.
You can follow the same process also in Zebra BI Tables In case you realise your dataset is far too long you may choose to use Top N + Others feature to keep focus on topmost important rows.
Best Practices for Counting Rows in Power BI
When counting rows in Power BI, there are a few best practices to keep in mind:
- Be mindful of performance: counting rows can be resource-intensive, especially for large data sets, so make sure to evaluate the impact on performance before using any counting methods
- Consider the context: when using DAX expressions or measures to count rows, consider context, mainly when calculating running totals or averages.
- Document your methods: make sure to document the counting methods you use, as well as any filters or criteria you apply, to ensure consistency and reproducibility.
Another best practice to keep in mind when counting rows in Power BI is to use the appropriate counting method for your specific needs. For example, if you only need a rough estimate of the number of rows in your data set, using the COUNT function may be sufficient. However, using the COUNTROWS function may be more appropriate if you need an exact count.
It's also important to consider the column's data type you are counting. If the column contains null values, using the COUNT function may not give you an accurate count. In this case, using the COUNTROWS function or filtering out the null values before counting may be necessary.
Troubleshooting Common Issues when Counting Rows in Power BI
Common issues when counting rows in Power BI include formula errors, incorrect table names, and data type mismatches. Make sure to double-check your formulas and data sources to avoid any mistakes. Additionally, if you encounter any issues, check the Power BI community forums or seek help from a Power BI expert.
Another common issue when counting rows in Power BI relates to the data source. If the data source is not correctly formatted or contains errors, it can affect the accuracy of row counts. It is essential to ensure the data source is clean and properly formatted before importing it into Power BI. This can be done using data cleaning tools or manually reviewing the data. By taking these steps, you can avoid issues with row counts and ensure that your data is accurate and reliable.
Advanced Techniques for Counting Rows in Power BI
Finally, consider exploring more complex DAX expressions or unconventional visualization methods for more advanced counting techniques. For example, you could use dynamic segmentation or grouping to count rows based on specific data points or create custom visuals to display row counts creatively and engagingly.
By following these tips and techniques, you'll be able to count rows in Power BI efficiently, accurately, and effectively, helping you gain deeper insights and make more informed business decisions.
Transform Your Reports with Zebra BI and Power BI
Spend less time preparing comprehensive reports and more time analyzing data