Time is money – we know it all too well. Well-designed dashboards are only useful if they’re fast. Long load times frustrate users, reduce adoption, and cost resources. This checklist merges insights from Zebra BI’s latest Power BI Performance Optimization Checklist with proven best practices to help you build reports that load quickly, scale well, and deliver value. Use it while designing, reviewing, or optimizing Power BI reports and make them run up to 10x faster.
How to Use This Checklist
Measure after changes to validate improvements.
Baseline current performance using tools like Performance Analyzer.
Prioritize items based on your performance pain points.
Apply in order (data model → visuals → query tuning) for maximum impact.
1. Analyze your performance
What to do
Aim for 0.5–1s total page load time.
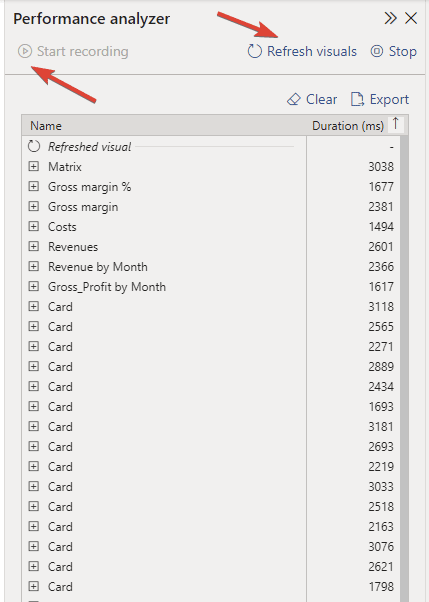
Run Performance Analyzer in Power BI Desktop to measure how individual visuals render.
Use DAX Studio for deeper query-level analysis.
Export the Performance Analyzer logs (JSON) to review detailed load times.
How to implement
In Power BI Desktop → open Performance Analyzer: record a page load, note which visuals/measures take too long.
Copy queries from Performance Analyzer to DAX Studio to analyze query plans or database issues.
Export the analyzer results as JSON for further offline (or team) review, especially for repeated bottlenecks.
Performance analyzer pane showing load times for individual elements
2. Speed up your data model
What to do
Use clean star schema: fact + dimension tables (not flat wide tables).
Transform in Power Query or data source rather than in DAX.
Remove or hide unused columns and foreign keys.
Reduce precision of measures (e.g. limit decimals).
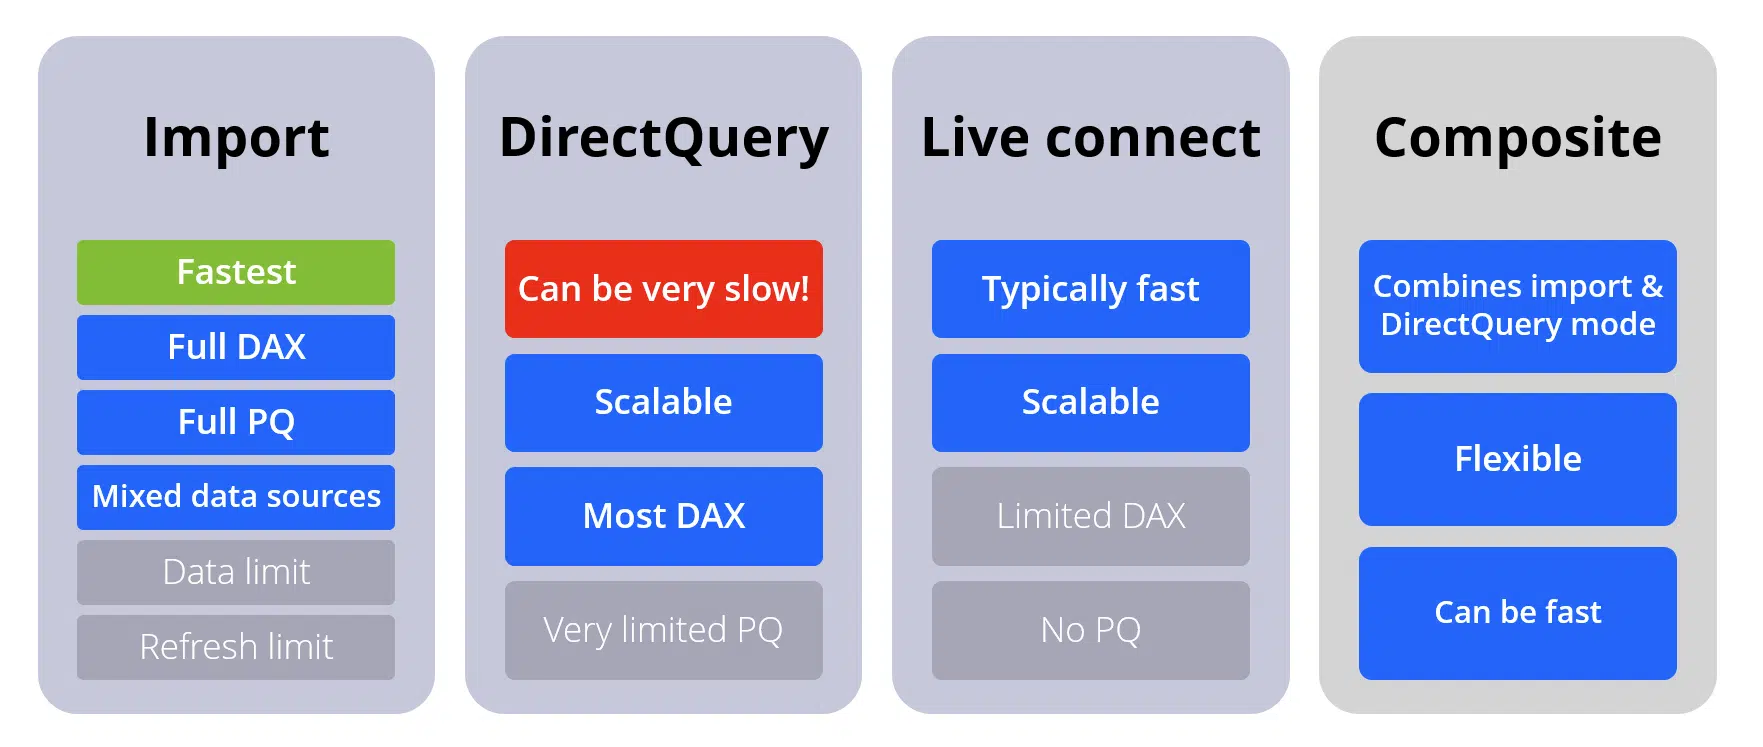
Use Import mode preferentially; minimize use of Composite or DirectQuery.
Simplify row-level security (RLS) rules.
How to implement
Combine/append fact tables when it makes sense; split dimension tables for hierarchies/attributes.
Turn off auto-date tables and split Date/Time into separate fields.
Hide ID (foreign key) fields from report view so only explicit measures are shown.
In modeling, choose Import over DirectQuery, reserve DirectQuery only for real-time data needs.
If using RLS, apply on dimensions with simple rules; avoid lookups or complex joins.
Here's a quick break-down of what you can do.
Fact Table:
Measures
Implicit (hide)
Explicit (use only these)
Reduce precision (no more than 2 decimals)
Foreign keys
Integer only!
As short as possible
Hide foreign keys from report view – so the fact table shows only the explicit measures for the users
Reduce granularity
Dimensions:
Hide foreign keys (IDs)
Only necessary columns (use lean fact tables – long, not wide)
Calendar key: Date
Split Date/Time into Date and Time columns
Avoid calculated columns (if you absolutely need them, add them in Power Query)
Turn off Power BI’s auto-date table
Relationships to fact table: 1-to-many
An overview of connection modes
3. Speed up your reports and visuals through design
What to do
Reduce the number of visuals per page.
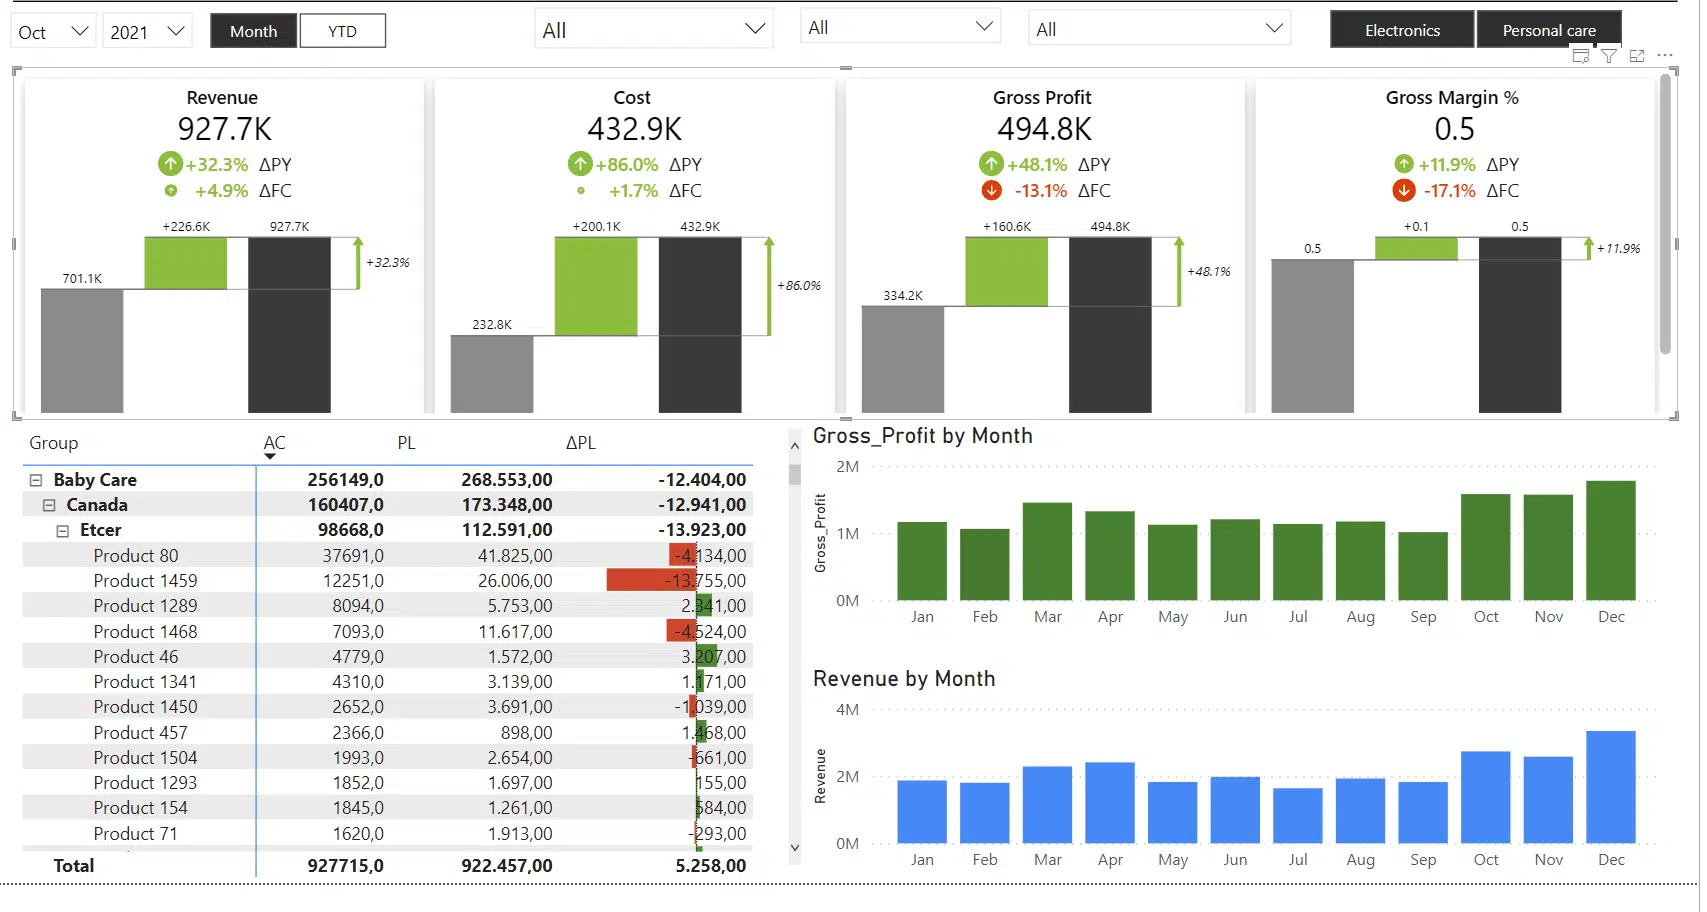
Use multi-card visuals (or combined visuals) to present KPIs without many separate visuals.
Organize layout from high-level overview → detail (top to bottom).
Lazy-load visuals using bookmarks/hidden visuals.
How to implement
Use bookmarks and visibility controls so non-critical visuals are only loaded/displayed when requested.
Limit to 7-8 visuals per page or fewer. Prioritize key visuals first.
Use visuals that combine multiple metrics (e.g. Zebra BI visuals) instead of many individual charts.
Build pages so that summary comes first; details load later or are hidden until needed.
Efficient Power BI report design
4. DAX & Calculations
What to do
Simplify DAX formulas (avoid nested FILTER/CALCULATE where possible).
Use measures over calculated columns especially in fact and dimension tables.
Use VAR to reuse intermediate computations.
Use efficient functions for non-additive operations (e.g. DIVIDE).
How to implement
Avoid manually built IF/SWITCH that can be replaced by DIVIDE or other optimized functions.
Audit measures: refactor ones that have many nested context filters.
Move complex calculations into Power Query or upstream in the data source.
Use VAR blocks in measures to compute once instead of repeating logic.
If RLS is needed, apply at dimension level, avoid complex filters.
In service settings, enable any caching, schedule refresh during lower usage.
Clean up unnecessary datasets, split reports/workspaces if needed.
8. Best Practices for Ongoing Optimization
What to do
Reuse base measures.
Use realistic, production-scale data volumes for testing.
Regularly audit and clean up models.
Maintain performance standards (e.g. max visuals/page, target page load times).
How to implement
Build a library of standard reusable measures.
Before publishing, test reports with data volumes similar to production.
Quarterly review of unused tables/fields; archive or remove.
Document in team guidelines: acceptable limits on visuals, acceptable load times, etc.
Additional materials & information
If you're as fascinated as we are by Power BI performance optimization possibilities, we've got great news – there's always more to learn! Feel free to check out the links below to dive deeper into this.
Try the Power BI Performance Optimization Webinar to see all these principles in action. Sign up below, it's free!