 September 8th
 February 22nd
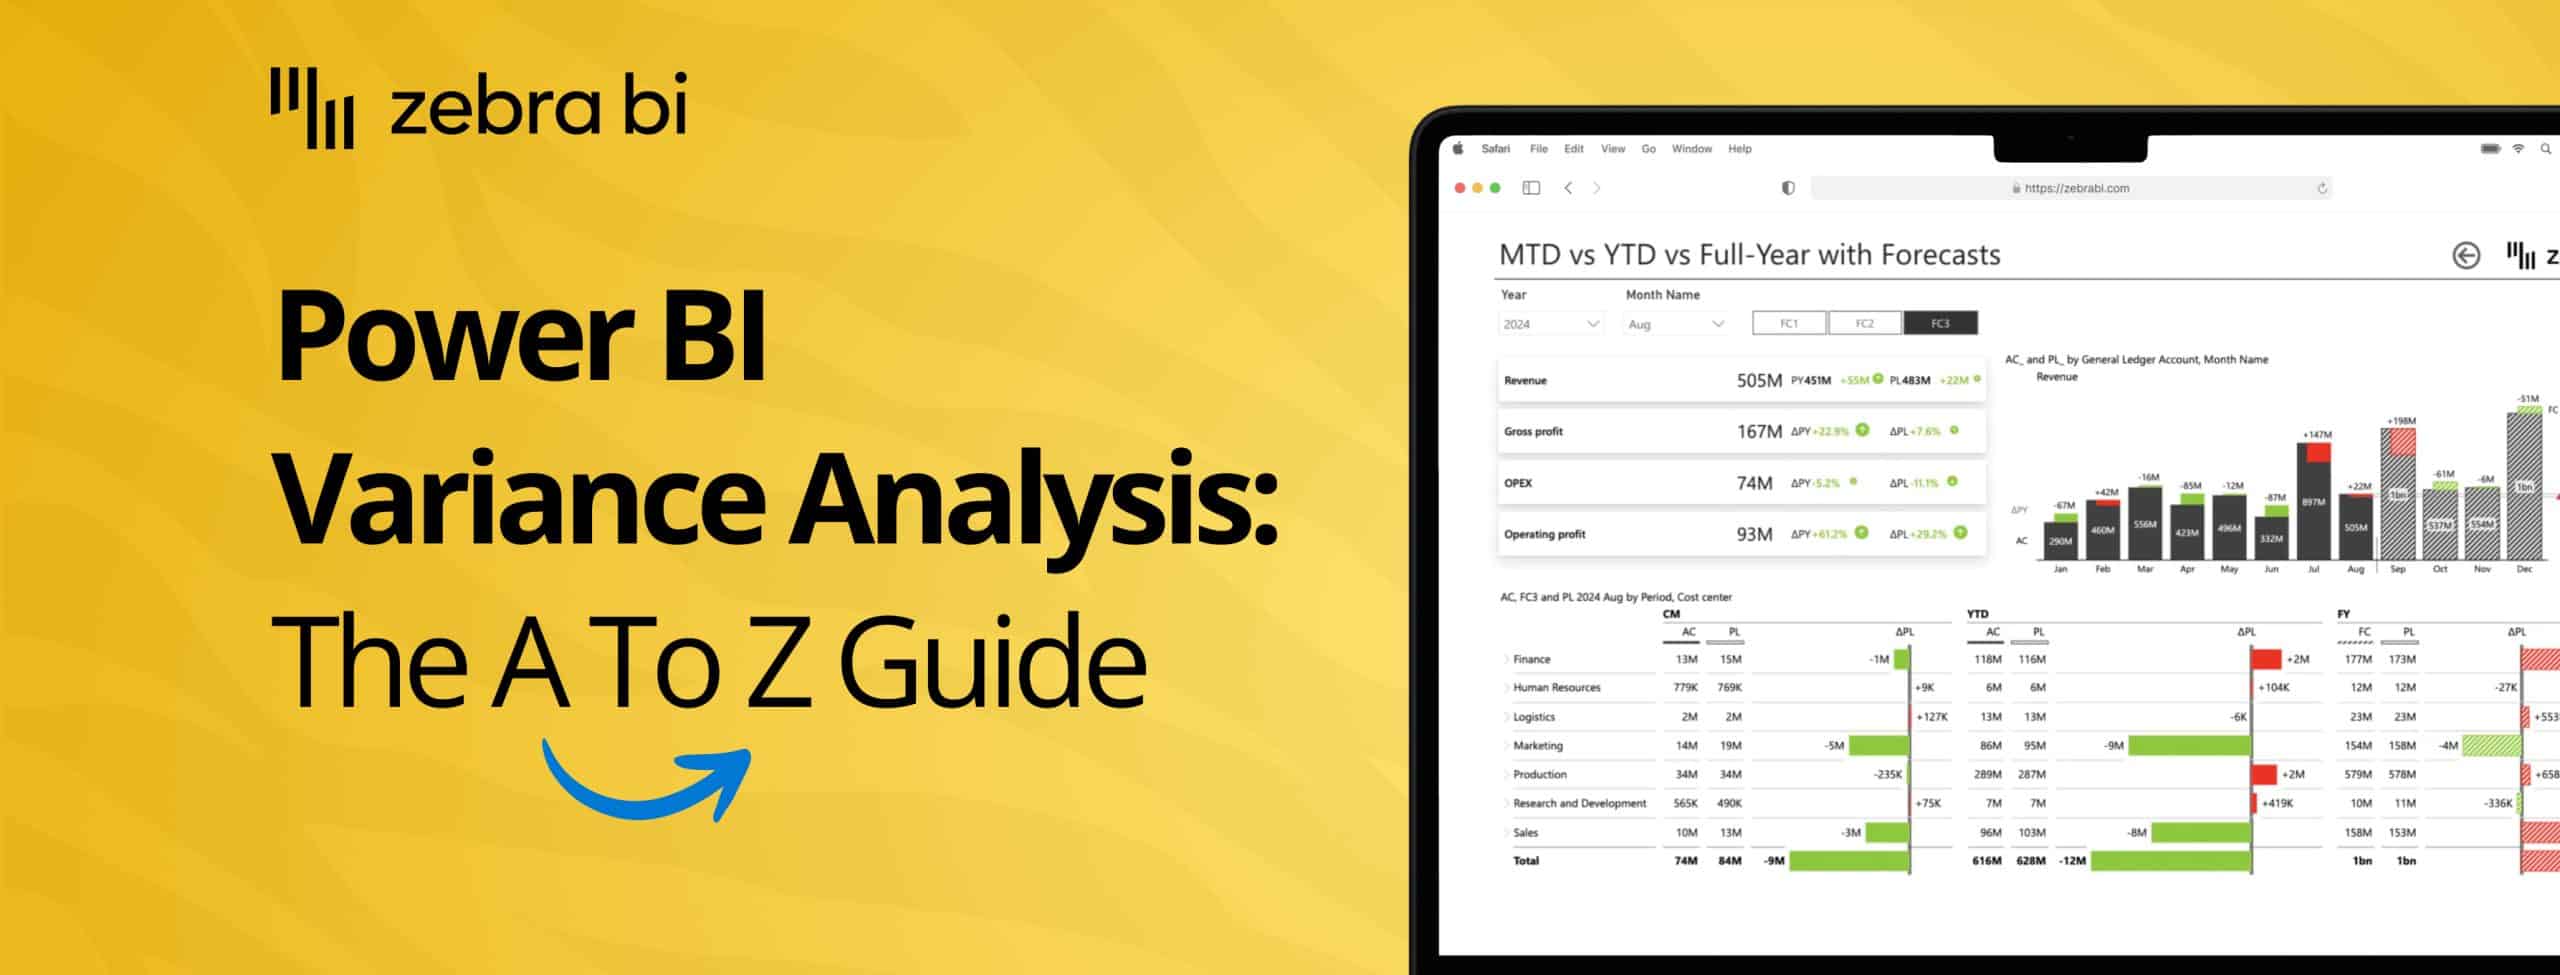
Power BI Variance Analysis: What It Is and How to Get Started
PRO Trial
Every business faces the same fundamental question: Are we on track?
Whether you're a financial analyst reviewing quarterly performance, a controller preparing board reports, or a business manager monitoring departmental budgets, you need to know if your actual results match your expectations. This is where Power BI variance analysis becomes essential.
Traditional variance analysis often means drowning in Excel spreadsheets, manually updating formulas, and struggling to make numbers tell a clear story. Power BI transforms this process, turning static comparisons into dynamic, visual insights that help you understand performance at a glance.
In this guide, you'll learn what variance analysis is, why it matters for business decision-making, and how to calculate variance in Power BI. We'll cover the fundamentals to get you started, and then point you to our comprehensive implementation guide for detailed chart configurations and advanced scenarios.
What is variance analysis?
Variance analysis is the process of comparing actual business performance against a benchmark to identify differences and understand their implications. These benchmarks typically include budgets, forecasts, or prior period results.
At its core, variance analysis answers critical business questions:
- Are we spending more or less than planned?
- Is revenue meeting our forecasts?
- How does this quarter compare to last year?
- Which departments are over or under budget?
The business value is straightforward: variance analysis identifies performance gaps before they become critical problems. When you spot a significant variance early, you can investigate root causes and take corrective action. A favorable variance might reveal successful strategies worth replicating, while an unfavorable variance signals areas needing immediate attention.
Common use cases for variance analysis
Financial performance monitoring tops the list of variance analysis applications. Finance teams track revenue, expenses, and profitability against annual budgets to ensure the organization stays on course.
Budget versus actual tracking helps controllers and CFOs maintain fiscal discipline. When actual spending exceeds budget by a significant threshold, it triggers reviews and potential reforecasting exercises.
Forecast accuracy assessment becomes crucial for organizations that rely on rolling forecasts. By comparing actual results to recent forecasts, finance teams can improve their forecasting models and build more reliable projections.
Year-over-year comparisons reveal growth trends and seasonal patterns. Retailers compare holiday season performance across years, while SaaS companies track monthly recurring revenue growth rates.
Types of variance analysis in business
Understanding the different types of variance helps you choose the right analysis for your situation.
Absolute vs. relative variance
Absolute variance shows the raw difference between actual and benchmark figures. If your budget was $500,000 and actuals came in at $550,000, the absolute variance is $50,000. This tells you the magnitude of the difference in real terms.
Relative variance expresses the difference as a percentage. Using the same example, the relative variance is 10% ($50,000 ÷ $500,000). Percentages make it easier to compare variances across different scales. A $50,000 variance means something very different for a $500,000 budget versus a $5,000,000 budget.
Most organizations use both metrics together. Absolute variance shows the financial impact in absolute terms while relative variance shows the significance of the impact in relative terms.

Favorable vs. unfavorable variance
Not all variances are created equal. A favorable variance improves your financial performance, while an unfavorable variance hurts it.
Here's where it gets tricky: higher numbers aren't always favorable. Revenue above budget is favorable, but expenses above budget are unfavorable. When analyzing variances, you need to consider the nature of each metric.
For a variance report, this means:
- Revenue actual > budget = Favorable (positive)
- Expense actual > budget = Unfavorable (negative)
This inversion for certain KPIs is critical when you're building Power BI variance reports. Your visualizations need to reflect the true business impact, not just whether numbers went up or down.
Comparison dimensions
Power BI variance analysis typically focuses on three main comparison types.
- Actual vs. Budget (Plan) remains the most common variance analysis. Organizations build annual budgets and then track monthly performance against these targets. This comparison drives accountability and helps ensure strategic initiatives stay funded while discretionary spending stays controlled.
- Actual vs. Forecast matters for organizations using rolling forecasts or those operating in dynamic markets. While budgets might be set annually, forecasts update quarterly or monthly to reflect changing business conditions. Comparing actuals to the most recent forecast provides a more current performance picture than budget comparisons alone.
- Actual vs. Prior Period reveals trends and growth patterns. Year-over-year (YoY) comparisons filter out seasonality by comparing the same period across different years. Month-over-month (MoM) and quarter-over-quarter (QoQ) comparisons show shorter-term momentum and help identify inflection points.
Different industries and roles emphasize different comparisons. Retailers focus heavily on year-over-year analysis due to seasonal patterns. SaaS companies track month-over-month growth metrics. Public companies often highlight quarter-over-quarter comparisons in earnings reports.
Why Power BI for variance analysis?
Power BI fundamentally changes how organizations approach variance analysis by addressing the limitations of traditional spreadsheet-based approaches.
Dynamic calculations and automatic updates
Unlike static Excel reports that require manual refreshes, Power BI connects directly to your data sources and updates calculations automatically. When new actual data flows in from your ERP system or financial database, your variance analysis refreshes without intervention. This eliminates version control issues and ensures everyone works from the same current data.
Visual storytelling beyond spreadsheet tables
Numbers in rows and columns can obscure the story your data tells. Power BI transforms variance data into visual formats that make patterns immediately obvious. A manager can glance at a variance chart and instantly see which months performed above or below plan, without scanning through tables of numbers.
Visual elements like color coding (green for favorable, red for unfavorable) and variance bars make reports more intuitive. Non-financial stakeholders can understand performance without deep accounting knowledge.
Interactive exploration
Static reports force you to anticipate every question your audience might ask. Power BI's interactive features let users explore data themselves. They can filter to specific departments, drill down from annual totals to monthly details, or slice by product category.
This self-service capability reduces the back-and-forth between report creators and consumers. Instead of requesting custom reports, managers can answer their own follow-up questions by interacting with the dashboard.
Integration across data sources
Variance analysis often requires combining data from multiple systems. Actuals might come from your ERP system, budgets from your planning tool, and forecasts from a separate financial model. Power BI connects to all these sources and brings the data together in one place.
This integration capability extends to complementary data as well. You can enrich variance analysis with operational metrics, customer data, or external benchmarks to provide context for financial variances.
Scalability for growing complexity
A simple variance report might compare total company actuals to budget. As your needs evolve, you can add complexity: multiple comparison types, hierarchical drilling, forecast integration, and small multiples showing variance across numerous dimensions.
Power BI scales from simple to sophisticated without requiring you to rebuild from scratch. The same foundation supports both basic variance charts and complex multi-dimensional analyses.
Collaboration and sharing
Finance teams can publish variance reports to the Power BI service, where stakeholders access them through web browsers or mobile apps. This ensures consistent reporting and eliminates the proliferation of emailed spreadsheets with unclear versions and timestamps.
Power BI enables variance analysis, but proper visualization requires the right approach and purpose-built tools. For detailed implementation guidance on creating professional variance reports, see our complete guide to variance reports in Power BI.
How to calculate variance in Power BI
Calculating variance in Power BI centers on creating DAX measures that compute the differences between your actual values and benchmarks.
Basic variance formulas
The fundamental variance calculation is straightforward. If you have measures for your actual values and budget values, absolute variance is simply the difference:
Absolute Variance = [Actual] - [Budget]
This gives you the raw dollar or unit difference. A positive result means actuals exceeded budget, while a negative result means actuals fell short.
For relative variance expressed as a percentage:
Variance % = DIVIDE([Actual] - [Budget], [Budget])
The DIVIDE function in DAX handles division safely, returning blank instead of errors when the denominator is zero. This prevents errors in your reports when budget values might be zero for certain periods or categories.
You might want to show both absolute and relative variance together. Users can then see both the magnitude of the variance ($50,000) and its proportional significance (10%).
Time intelligence considerations
Variance analysis becomes more sophisticated when dealing with time-based comparisons. Year-to-date (YTD) variance shows cumulative performance from the start of your fiscal year to the current period.
To calculate YTD variance, you first need YTD measures for both actuals and budget:
YTD Actual = TOTALYTD([Actual], 'Date'[Date])
YTD Budget = TOTALYTD([Budget], 'Date'[Date])
YTD Variance = [YTD Actual] - [YTD Budget]
These calculations require a proper date table in your data model. Power BI's time intelligence functions like TOTALYTD, SAMEPERIODLASTYEAR, and DATEADD rely on a well-structured calendar table to work correctly. Without it, your time-based variance calculations may produce incorrect results.
Period-over-period comparisons require different approaches. For year-over-year variance:
Prior Year Actual = CALCULATE([Actual], SAMEPERIODLASTYEAR('Date'[Date]))
YoY Variance = [Actual] - [Prior Year Actual]
YoY Variance % = DIVIDE([Actual] - [Prior Year Actual], [Prior Year Actual])
Measures vs. calculated columns
When building variance calculations, you'll choose between measures and calculated columns. Measures perform calculations at query time and aggregate based on your visual's context. Calculated columns compute row-by-row when your data refreshes and store the results.
For variance analysis, measures are almost always the right choice. Variance calculations need to aggregate appropriately when users filter or slice data. A measure automatically recalculates based on the current filter context, showing variance for the selected time period, department, or product category.
Calculated columns would compute variance at the most granular level of your data (often individual transactions) and then try to sum those row-level variances. This rarely produces meaningful results for variance analysis.
Simple example walkthrough
Imagine you have a sales data model with an Actuals table containing transaction data and a Budget table with planned sales by month and product category. Both tables relate to a Date table.
First, create base measures:
Total Sales = SUM(Actuals[Sales Amount])
Budgeted Sales = SUM(Budget[Budget Amount])
Then build your variance measures:
Sales Variance = [Total Sales] - [Budgeted Sales]
Sales Variance % = DIVIDE([Total Sales] - [Budgeted Sales], [Budgeted Sales], 0)
Place these measures in a matrix visual with months on rows, and you immediately see which months performed above or below budget. Add product category to see variance by product line. The same measures work across different visual contexts without modification.
This covers the calculation basics. For advanced scenarios like handling missing budget data, complex fiscal calendars, or integrated forecast comparisons, see our comprehensive variance reports implementation guide.
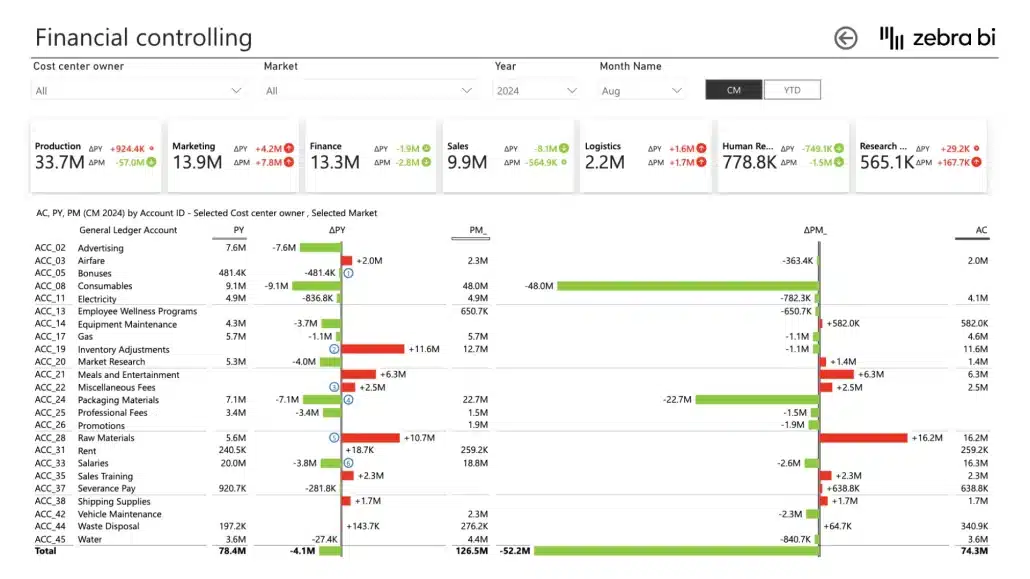
Also, here's a visual guide on how you can do variance analysis in Power BI:
Visualizing variance in Power BI
Once you've calculated variances, the next challenge is presenting them in a way that drives understanding and action. Power BI offers multiple approaches, each with strengths and limitations.
Native Power BI visuals
Power BI's built-in visuals provide a starting point for showing variance in Power BI, though they require considerable manual configuration to be effective.
- Clustered bar or column charts can display actual and budget values side by side. Add your time dimension (like Month) to the axis, then add both [Actual] and [Budget] measures to values. This creates grouped bars that let viewers compare the two values visually.
The limitation: variance itself isn't prominently displayed. Users must mentally calculate the difference between bars. You can add data labels, but the chart doesn't highlight favorable versus unfavorable variances automatically.
- Line charts work well for trending variance over time. Plot both actual and budget as separate lines, and the gap between them shows variance. This approach works particularly well for long time series where you want to show whether actuals are converging with or diverging from plan.
Again, the gap between lines indicates variance, but users must interpret the magnitude and significance themselves. There's no automatic highlighting of periods with significant variances.
- Tables with conditional formatting offer more flexibility. Create a matrix with your dimensions on rows and measures (Actual, Budget, Variance, Variance %) in columns. Apply conditional formatting to the variance columns to color-code favorable (green) and unfavorable (red) results.
This approach works for detailed variance analysis where users need specific numbers. The downside is limited visual impact compared to charts, and tables become cluttered with many rows of data.
Challenges with standard visuals
Standard Power BI visuals require significant manual work to create effective variance displays. You must configure conditional formatting rules, manually adjust colors, and ensure the formatting makes sense for your specific metrics.
The bigger challenge is handling metrics where higher values are unfavorable. Revenue increasing is good, but expenses increasing is bad. Native visuals don't automatically understand this inversion. You might color code all positive variances as green, which incorrectly shows expense overruns as favorable.
Another limitation is the lack of variance-specific features. You can't easily show waterfall patterns that connect period-to-period changes, or display relative and absolute variance simultaneously in an intuitive format.
Setting up even a basic variance chart from native visuals is time-consuming. Each visual requires individual configuration for colors, data labels, axes, and formatting. Maintaining consistency across multiple variance reports becomes a significant effort.
Professional variance visualization
Purpose-built variance visuals address these limitations by offering pre-configured formats designed specifically for variance analysis. These specialized charts understand the context of variance reporting and automate much of the formatting work.
Waterfall charts show how individual periods contribute to cumulative totals, making them ideal for seeing how monthly variances add up to year-to-date results. Area charts emphasize trends while minimizing visual clutter, drawing attention to the variance itself rather than the overall magnitude of values.
Integrated variance displays show actual values alongside variance indicators in a single compact visual. Users can see both the absolute performance and how it compares to plan without jumping between multiple charts.
These professional approaches also handle the complexity of mixed KPIs where some metrics are inversely scored. The visualization automatically displays expense overruns in red and expense savings in green, without manual configuration for each metric.
For detailed guidance on selecting and configuring specific variance chart types, implementing small multiples for dimensional analysis, and building variance reports that include forecasts and hierarchies, see our comprehensive guide to mastering variance reports in Power BI.
Best practices for variance analysis
Effective variance analysis requires more than just calculations and charts. These best practices help ensure your variance analysis drives meaningful insights and actions.
Choose meaningful comparisons
Align your variance analysis with how your business actually operates and makes decisions. If your company uses rolling quarterly forecasts rather than static annual budgets, actual versus forecast comparisons will be more relevant than actual versus budget.
Consider your audience's needs. Executive dashboards might focus on year-over-year growth to show strategic progress, while operational managers need month-over-month variance to manage current performance.
Don't create variance reports just because you can. Each comparison should answer a specific business question or support a particular decision-making process.
Set clear benchmarks
Your variance analysis is only as good as your benchmark data. Ensure your budget or forecast data is reliable, approved, and represents realistic expectations rather than aspirational goals.
Document which version of budget or forecast you're using for comparisons. Organizations often revise budgets mid-year or maintain multiple forecast scenarios. Make it clear whether you're comparing to original budget, revised budget, or latest forecast.
Keep benchmark data at the same granularity as your actuals. If you have daily actuals but only monthly budgets, you'll need to distribute monthly budgets to daily values or aggregate actuals to monthly for fair comparison.
Define variance thresholds
Not every variance deserves attention. Establish thresholds that separate significant variances from normal fluctuations. These might be absolute thresholds ($50,000 variance) or relative thresholds (10% variance).
Thresholds should be context-dependent. A 5% variance might be significant for high-volume, predictable revenue streams but normal for volatile expense categories or early-stage business units.
Use these thresholds to focus attention. Highlight variances exceeding thresholds on your dashboards, and establish processes for investigating and documenting explanations for significant variances.
Consider context
Raw variances don't tell the complete story. A revenue shortfall might reflect industry-wide headwinds rather than execution problems. An expense overrun might fund an unexpected opportunity that will generate future returns.
Build context into your variance reports by including explanatory notes, links to supporting documentation, or additional metrics that provide perspective. If revenue is down 15% but the overall market is down 20%, that context changes the interpretation.
Seasonality, economic conditions, competitive dynamics, and internal factors like leadership changes or system implementations all affect variance and should inform your analysis.
Regular monitoring
Variance analysis works best as an ongoing discipline rather than a quarterly surprise. Establish regular review cadences—weekly for operational metrics, monthly for departmental performance, quarterly for strategic reviews.
Consistent timing creates accountability and allows trends to emerge. If variances persist across multiple periods, they signal systemic issues rather than one-time events.
Make variance review part of your standard operating rhythm. Include variance analysis in team meetings, management reviews, and board reporting. When variance analysis becomes routine, organizations develop better institutional knowledge about their performance patterns.
Actionable insights
The ultimate goal of variance analysis is action, not just observation. Your variance reports should lead naturally to questions about root causes and discussions about corrective actions.
Structure your analysis to move from "what happened" to "why did it happen" to "what should we do about it." This might mean drilling down from summary variances to detailed transaction data, or linking variance reports to operational dashboards that show underlying drivers.
Document not just the variances but the follow-up actions. When expense variances exceed thresholds, who investigates? What's the timeline for response? How do you track whether corrective actions had the intended effect?
Data quality
Variance analysis amplifies data quality issues. If your actuals data is delayed, incomplete, or inaccurate, your variance analysis will be misleading rather than helpful.
Invest in data quality processes before building sophisticated variance reports. Ensure timely data loads, validate that actuals are complete for the analysis period, and reconcile your Power BI data to source systems regularly.
Similarly, maintain clean budget and forecast data. Ensure allocations are complete, track any mid-year budget changes, and validate that your benchmark data loads correctly into Power BI.
Common challenges and solutions
Even with strong fundamentals, you'll encounter specific challenges when implementing variance analysis in Power BI. Here's how to address the most common issues.
Handling negative KPIs
One of the trickiest aspects of variance reporting is handling metrics where lower values are better. For revenue, growth is good—higher actuals mean favorable variance. For expenses, growth is bad—higher actuals mean unfavorable variance.
This matters enormously for visualization. If you simply color all positive variances green and negative variances red, you'll incorrectly show expense overruns as favorable.
The solution requires inverted logic for certain metrics. In your data model, you need to identify which KPIs are "negative" (where lower is better) and handle them differently in calculations and formatting.
Advanced variance visualization tools can manage this automatically once you flag certain metrics as inverted. When an expense variance is positive (actuals exceeded budget), the visualization shows it in red to indicate an unfavorable result, even though the number is positive.
For detailed guidance on implementing this inverted logic and configuring visualizations to handle mixed KPIs correctly, see our variance reports implementation guide.
Mixing different variance types
Some reports need to show multiple variance types together—actual versus budget alongside actual versus forecast, or absolute variance alongside relative variance.
The challenge is avoiding confusion. Users need to clearly understand which benchmark applies to which calculation, and what the relative significance of different variances means.
Clear labeling is essential. Don't just show "Variance"—specify "Budget Variance" and "Forecast Variance." Use consistent color coding across variance types but differentiate them through layout or chart types.
Consider whether users really need multiple variance types simultaneously, or whether separate focused reports might be clearer. Sometimes trying to show everything in one place creates more confusion than clarity.
Data overload
Variance analysis can quickly become overwhelming when you analyze multiple dimensions simultaneously. A report showing variance across 20 product lines, 12 months, and 5 regional offices creates hundreds of individual variances.
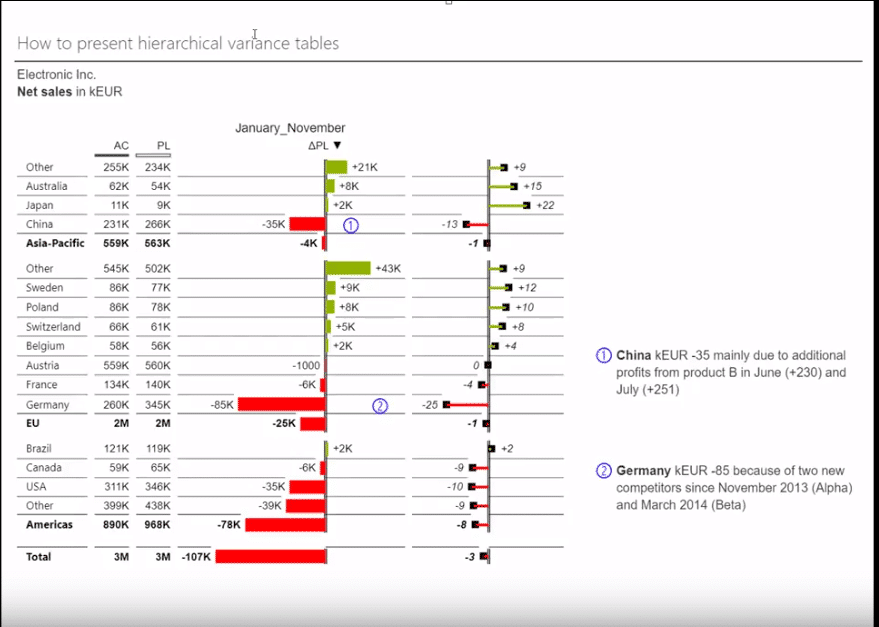
Hierarchical organization helps manage this complexity. Start with high-level summaries and let users drill down into details only where variances are significant. Show total company variance first, then allow drilling into divisions, then departments, then cost centers.
Small multiples—repeated charts showing the same variance type across different dimensions—provide powerful insight without overwhelming detail. You might show a grid of small variance charts, one for each product category, scaled consistently so users can quickly identify which categories need attention.
The implementation of hierarchical drill-down and small multiples requires careful configuration. Our comprehensive variance reports guide covers these techniques in detail, including how to set up proper hierarchies and configure small multiple visualizations effectively.
Forecast integration
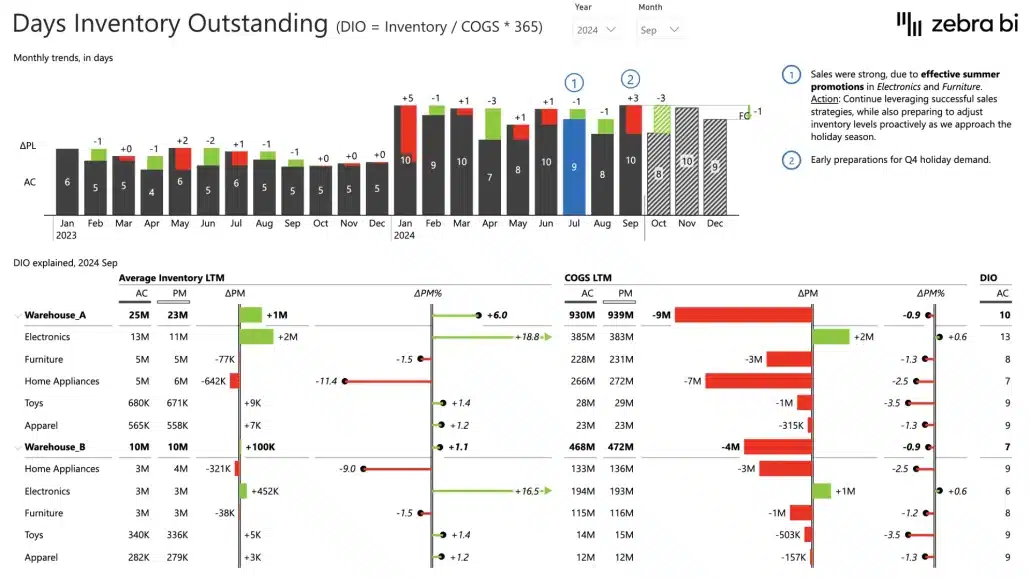
Variance analysis becomes significantly more powerful when it includes not just historical actuals and benchmarks but also forward-looking forecasts. Forecasting in Power BI enhances variance analysis by showing expected future performance alongside historical variance patterns.
The challenge is integrating forecast data smoothly. Your visualizations need to clearly distinguish historical actuals from future forecasts, show variance for both historical and forecast periods, and handle the transition between them seamlessly.
Forecast data might come from different sources than actuals, potentially at different granularities or with different refresh cycles. Your data model needs to accommodate these differences while presenting a unified view.
Specialized variance visuals can display forecasts using distinct visual patterns (like hatched patterns) that clearly differentiate them from historical actuals while maintaining the same variance analysis framework.
For step-by-step guidance on adding forecasts to your variance reports, configuring the data model to handle forecast data, and setting up visualizations that seamlessly blend historical and forecast variance, see the forecast integration section of our complete variance reports guide.
From basics to advanced: Your next steps
You now understand the fundamentals of variance analysis in Power BI. You know what variance analysis is, why it matters for business decision-making, and how to calculate basic variances using DAX measures. You've learned about different comparison types, visualization approaches, and best practices for effective variance analysis.
But this is just the beginning. Implementing production-ready variance reports that deliver professional, board-ready insights requires additional knowledge and purpose-built tools.
Ready to Implement?
All of these advanced techniques and step-by-step implementation guidance are covered in our comprehensive implementation guide. If you're ready to move from understanding variance analysis concepts to actually building professional variance reports in Power BI, this is your next step.
Master Variance Reports in Power BI - Complete Implementation Guide →
The implementation guide provides detailed walkthroughs, configuration steps, and best practices for creating variance reports that deliver actionable insights to stakeholders across your organization.
And if you want to experience pre-configured variance visualizations, automatic variance calculations, IBCS-compliant, board-ready formatting, hierarchical drilling and small multiples “out of the box”, and integrated forecast support, give Zebra BI a trial. It's free.
Experience firsthand how specialized variance visuals transform your variance analysis from basic comparisons to professional insights that drive business decisions.