Price Volume Mix Variance Analysis in Excel
When looking at your revenue variance, you want to have a complete insight into what’s driving the changes you are seeing. You’re probably dealing with questions like “Are my margins eroding?”, “What are the most profitable products in my portfolio?”, “How is my product mix affecting my revenue?”. To find the answers, we'll explore the Price Volume Mix analysis and show you how to do it in Excel.
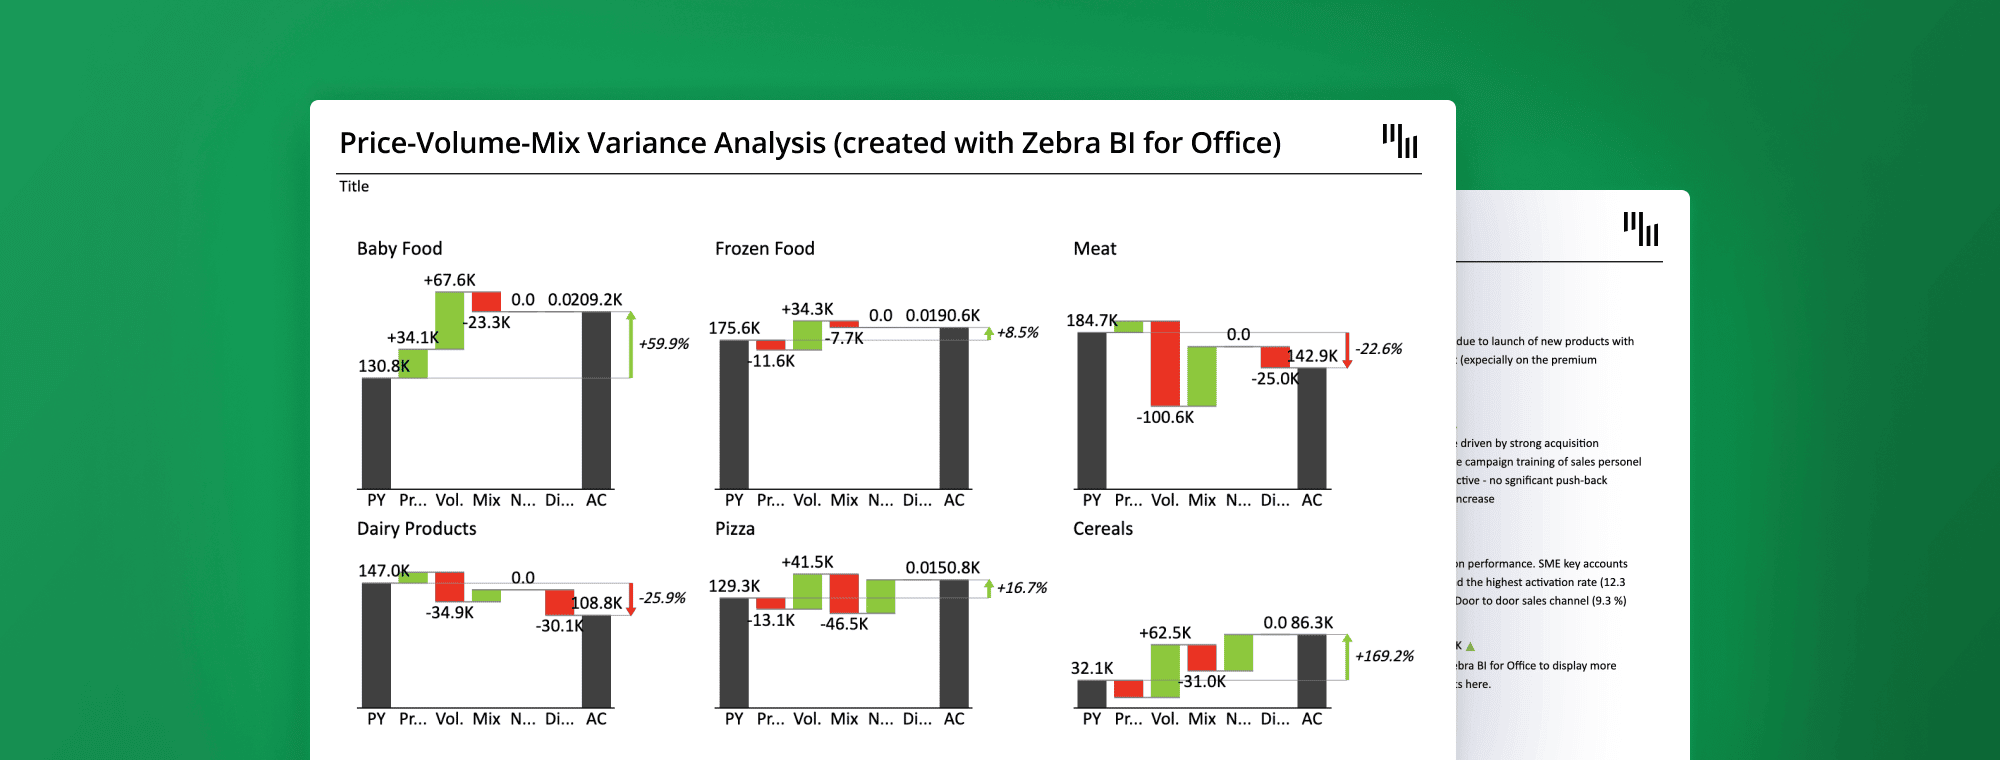
The new Zebra BI for Office lets you create an impressive Price Volume Mix Variance analysis in just one simple click. 👇
Want to create a Price-Volume-Mix Variance Analysis just like this one?
Start showing actionable reports to your C-suite, sales teams, product teams, managers, stakeholders and investors.
Zebra BI was made for:
- BI specialists
- FP&A specialists
- Consultants
- Digital transformation officers
- C-level and managers
The PVM analysis adds another dimension to your business reporting and is a great way to improve your understanding of your business. Read on to learn all about it & ace your reporting fast!
Overview
In this article, we'll explore how you can improve your business reports by including a Price Volume Mix analysis. We'll explain the three concepts and demonstrate how to prepare your data for analysis in Excel. Next, we’ll go on to show how to use Zebra BI for Office to visualize this analysis. Finally, we’ll discuss two different approaches to it and show which of the two delivers better results.
A robust PVM analysis deconstructs the total variance between two periods (e.g., current year vs. previous year) or between actuals and a budget. It allows you to precisely quantify the contribution of each core driver to your overall sales growth or decline. Understanding these three pillars is the first step to mastering the technique.
- Price Effect (Price Variance): This component measures the impact of changes in the average selling price of your products. A positive price effect indicates that you generated more revenue because you sold your products at a higher price than in the previous period, showcasing strong pricing power or successful implementation of new pricing strategies. Conversely, a negative effect might point to increased discounting or competitive price pressure.
- Volume Effect (Volume Variance): This measures the impact of changes in the quantity of products sold. The volume effect tells you how much of your revenue change is due to an increase or decrease in overall sales volume. A positive effect means you sold more units sold in total, reflecting strong market demand or effective marketing campaigns.
- Mix Effect (Mix Variance): This is often the most insightful yet misunderstood component. The mix effect quantifies the impact of changes in the composition of your sales. It answers the question: "Are customers buying a more or less profitable combination of products?" If your sales mix shifts towards higher-priced, higher-margin items, you will have a positive mix effect. If the shift is towards lower-priced items, the effect will be negative, even if your total sales volume remains the same. Understanding your product mix is crucial for portfolio management and profitability analysis.
Together, these three elements—Price, Volume and Mix—provide a complete narrative behind your top-line numbers.
Why a typical business report is not enough
Typically, when designing a business report, we take revenue, gross profits, income, and possibly some other KPIs and compare current results to the ones from the previous year, plan, or another target. Once we have these variances, we can drill down deeper and explore them by business units, geographical areas, products, etc. Most companies don’t go much further than that.
Let's take a look at a typical report.
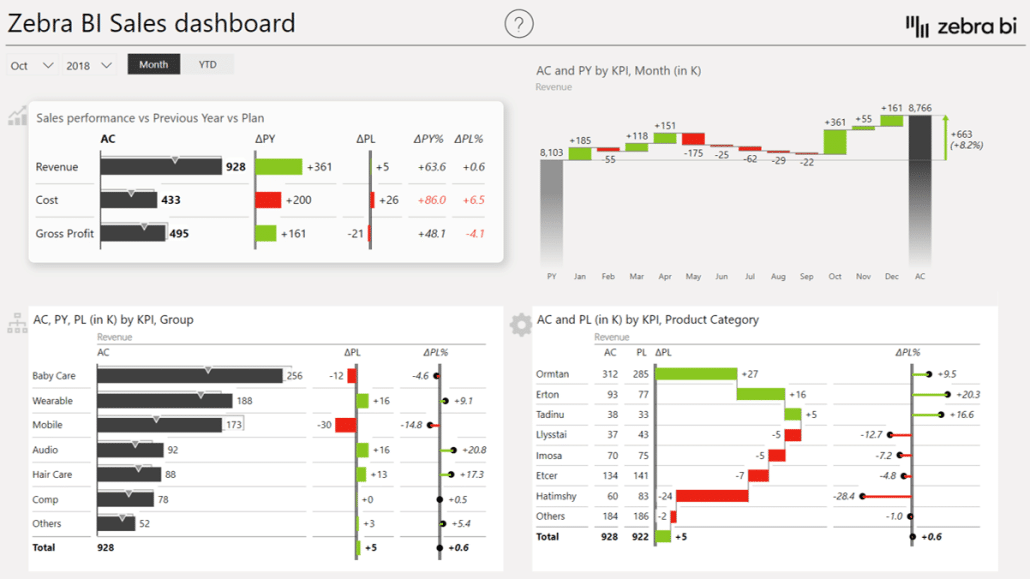
This is a good start, but there is a better way that deliver more insight. Namely, the Price Volume Mix analysis demonstrates how individual factors, such as price changes, sales volumes, and product mix, affect your revenue.
Price – This is the simplest concept to understand. Price simply reflects the price of your product as you sell it. It is the main contributor to the growth of margins in your business. An increased price directly translates into improved margins. But keep in mind that a higher price may result in lower volumes, as fewer customers decide to buy higher-priced products.
This is an important way of looking at your business. Let's take the price, which is one of the key factors affecting your growth and performance as a company. The relation is pretty straightforward – the increased price usually translates into improved performance. Volume is another factor that drives your company's growth. A growth in volume normally correlates to better performance unless it is offset by something else.
Volume – This is the number of products you sell. Selling more products at the same price means more revenue. However, the volume has little effect on your profit margins. Selling more products at lower prices reduces your profitability if the cost of goods remains unchanged.
Extra info: Want to create waterfall charts in Excel like the ones in the examples on this page? Nothing easier. Check our our easy guide on how to create waterfall charts in Excel.
How product mix affects revenue
Then there’s this third mysterious category called Mix. It’s a bit vague but adds a very important and interesting insight. Mix is not about the prices and it's not about the volumes. It actually explains how deep the change in the structure of your products goes.
Mix – This concept reflects the fact that not all products are created equal. Some products have better profit margins than others, which means that changes in your product mix will affect your revenue. Selling more products with better-profit margins drives up the revenue and vice versa.
It essentially reveals how your product mix affects the revenue. For example, are the products you’re selling of a higher value compared to last year’s? If the answer is yes, the mix will turn out to be positive. Are you selling more of your lower-value products? If so, this might be just what’s dragging your mix down.
Take a look at how Zebra BI shows you this data:
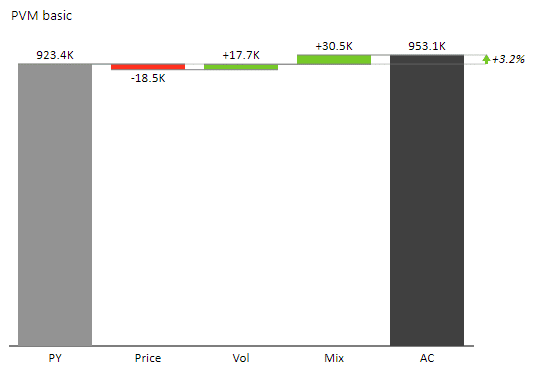
Let's review what it shows.
The chart shows that a 3.2% growth in sales can be attributed to different reasons. We can take a look at what drove the change. Did we increase or decrease the price of the products over the past year, and how did that drive the sales? Did it increase the volume or decrease it? Are we selling more items of the same product than last year or fewer? What is the total effect of the volume increases?
Once you get into Price Volume Mix variance analysis, you can really get creative. Instead of just analyzing the growth from the previous year, you can analyze the change in budget. Instead of using revenue, you can use your contribution margins or gross profit, making the story even more powerful. Using the profit, in particular, makes this analysis 10 times or 20 times more insightful.
Adding more dimensions
And there is no rule that says you have to stick with just these three categories, is there? After all, your business does have other drivers, too. Two typical ones are the new and discontinued products. Did you launch new products last year? If so, you can see the revenue that was achieved with just them. You could also take a look at the impact of the discontinued products. Once you add all this to your analysis, you can get a much clearer picture of what impacts your sales.
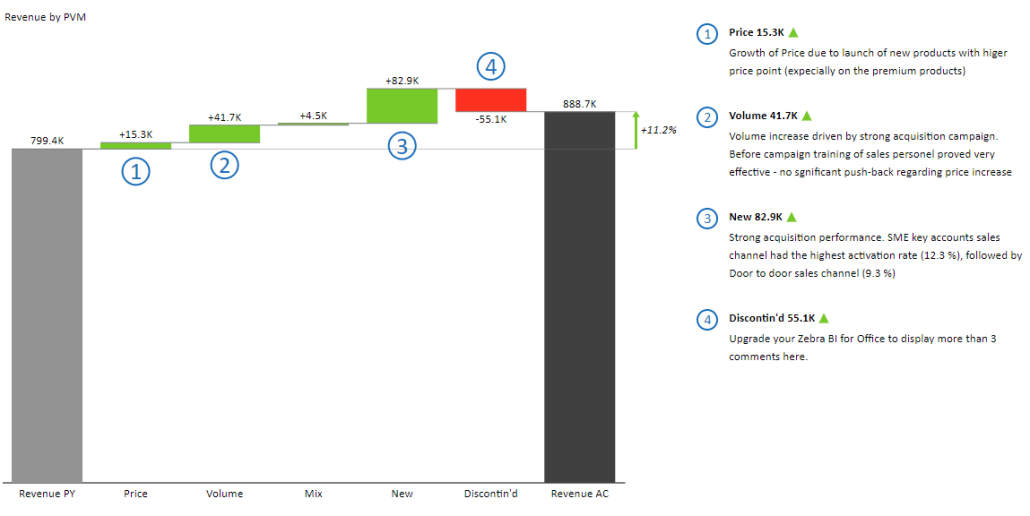
This is a great example of how powerful this type of analysis can be. At a glance, you can see whether new products offset the revenue lost from discontinued products. You can see the movements in your prices and product volume while also keeping your finger on the pulse of the performance of your product mix.
Want to create a Price-Volume-Mix Variance Analysis just like this one?
Download our detailed Excel template now and elevate your analysis effortlessly.
It is clear that the Price Volume Mix variance analysis should become an essential tool in your reporting belt. You can use it for ad-hoc analyses or make it a regular part of your quarterly or annual reports. Let’s take a look at how you can prepare and organize your data and do these calculations in Excel.
Price Volume Mix analysis in Excel
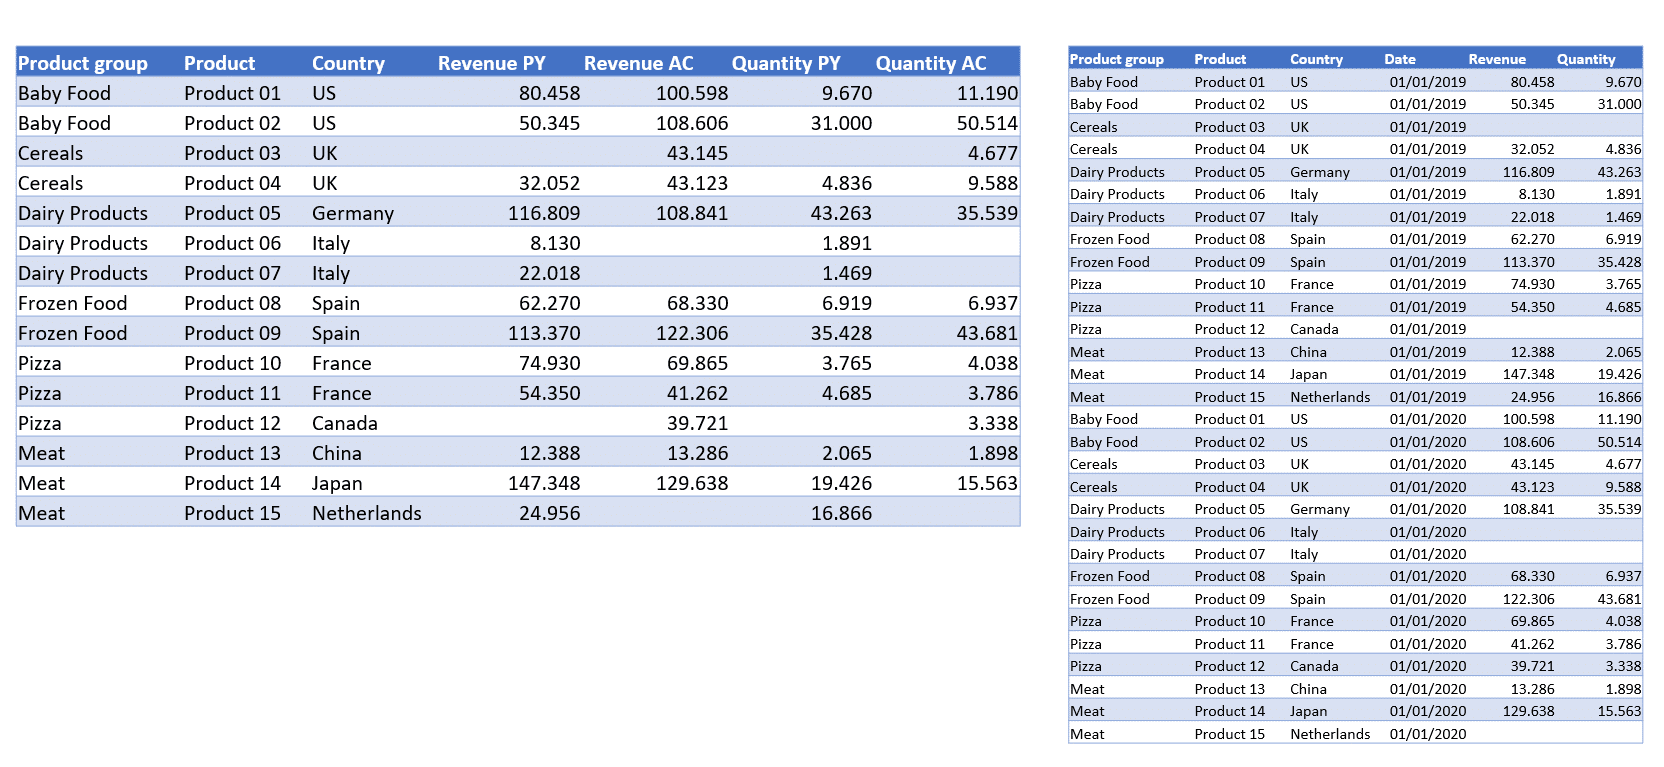
Let's start by explaining what you actually need to create your first Price Volume Mix variance analysis. The bare minimum you need is data by products – this can be products at the most basic levels, like SKUs for each and every product, product groups, or even more sophisticated hierarchies with sub-products.
You also need revenue for your current and previous year and quantities, which is simply the number of items sold in the current and previous year. You could also replace the previous year's data with your plans, even though many people do not plan product quantities.
Your data may vary, depending on where you exported it from.
The popular approach: The Mix Change Method
First, we'll look at a method for doing Price Volume Mix variance analysis that is very popular online; let's call it "The Mix Change Method." Despite its popularity, we do believe there is a better way to tackle this analysis. However, this method is popular enough that we want to show you how to do it in Excel using Zebra BI for Office.
Let's start by looking at the data. The first column has product groups, followed by two columns with sales revenues from this and the previous years. Here are the calculations for the Price PY and Price AC columns:
Price PY = Revenue PY / Quantity PYPrice AC = Revenue AC / Quantity ACYou also need to ensure you don't calculate the total prices as the average of all totals in the column. Instead, divide your total revenue with your total quantity. You now have everything necessary to calculate the price change, which is simply the difference between the two prices (AC and PY) multiplied by the number of units sold this year.
Looking at the example above, we can see the baby food prices went up while we are taking a large hit on the baked goods category because of declining prices. To calculate the total, you need to add up all the values in the entire Price column, and you get the overall impact of prices on your revenues. In our example, reduced prices in several categories resulted in a severe drop in revenues because of pricing.
Next up is the volume change; the trick here is to separate the volume effect from the mix effect. Put simply, the volume represents the number of products your customers buy, while the mix is that volume expressed in percentage.
Here are the formulas for calculating the Mix:
Mix PY = Quantity PY / SUM(Quantity PY)
Mix AC = Quantity AC / SUM(Quantity AC)Our table shows that baby food represented 5.1% of the entire volume of the products we sold, meaning that one out of twenty products sold in our stores was baby food. This year, this percentage grew to 5.4%, meaning we sell more baby food. This can be either good or bad. If baby food is a profitable product, that is good news. However, if this is a less profitable product, this could have a negative impact. Imagine you are selling more of your loss leader. That would have a serious impact on your bottom line.
Here is the formula to calculate the impact of the product mix on total revenue. First, calculate the change in the mix share (Mix AC - Mix PY). For baby food in our example, the change in portfolio share is 0.26%. The final calculation seems fairly complicated and reads as follows:
Mix = SUM(Quantity AC) / (Price PY - SUM(Revenue PY / SUM(Quantity PY)) * Mix ChangeThe basic idea here is to calculate the average revenue per unit. You take the sum of your revenue for the previous year. And then, you divide the quantity of products sold this year by the difference in the price of each product minus this average price. So basically, just think of it as taking the average price and then looking at whether the price of the baby food is higher than this average price.
In our example, baby food is priced higher than the average, and increasing the volume will grow our revenue. On the other hand, the baked goods category is priced below our average, which means increasing the volume will have a negative effect.
A better method for Price Volume Mix Variance analysis
The method we just described works with most data sets, but we don't think it is completely okay. We would like to talk about another way, which uses a different method for calculating the mix variance as simply a subtraction at the end of the process. This is a method recommended by Controller Akademie.
Here is the dataset we will be using.

As you can see, we introduced two new categories reflecting the product status:
New products are products that are only sold this year and can't be compared between years.
Discontinued products have not contributed to this year's results because they stopped being sold before or during this year.
In our example, we're simply checking whether revenue was first generated this year (for new products) or last generated last year (discontinued products).
The first change in how we calculate everything comes with volume change. First, we check that a product is active to exclude the new and discontinued products, which are not included under volume. We take the quantity this year minus the quantity of the previous year and multiply the result by the average revenue per unit from the previous year. Here's the formula:
Vol = IF(Status = "Active"; (Quantity AC - Quantity PY) * Price PY)What is most obviously different from the previous example is that the mix value is zero and will always be zero at the individual product or SKU level. Product mix means the change in the products within a certain group or in your total product portfolio. This is something most people get wrong and is slightly confusing. You should remember that your mix value should be zero at the base level.
Another very significant difference is in the Total row. Take the difference in the total quantity of products sold this year minus the quantity in the previous multiplied by the average price. We're not just adding up all the volume changes from our products and are instead doing the calculation on the level of the group. This is what actually ensures that you are excluding the effect of the prices in the volume of variance.
This approach results in a slightly different volume change on the level of the group, and that is why this then appears in your mix. The MIX is then simply: the total variance minus price variance, minus volume variance minus new products, minus discontinued products.
Visualizing Price Volume Mix data in Excel
Here is our data shown in Excel with Zebra BI for Office:
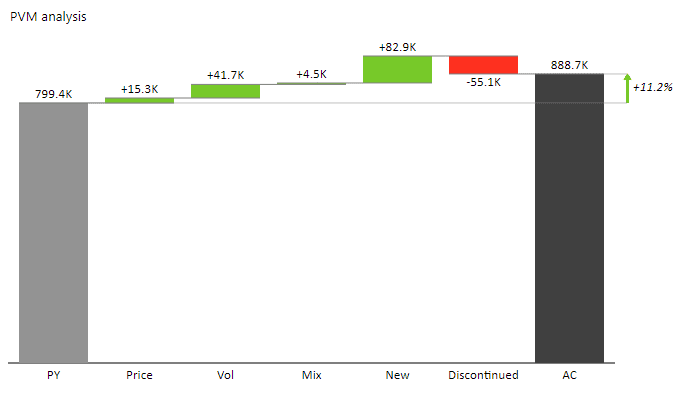
When creating this type of chart, make sure you turn on the difference highlight, showing the actual AC and PY revenue difference. This is a very meaningful visual emphasis that will definitely help you understand your data.
Once you have set it up, you can also use this data on each product level.
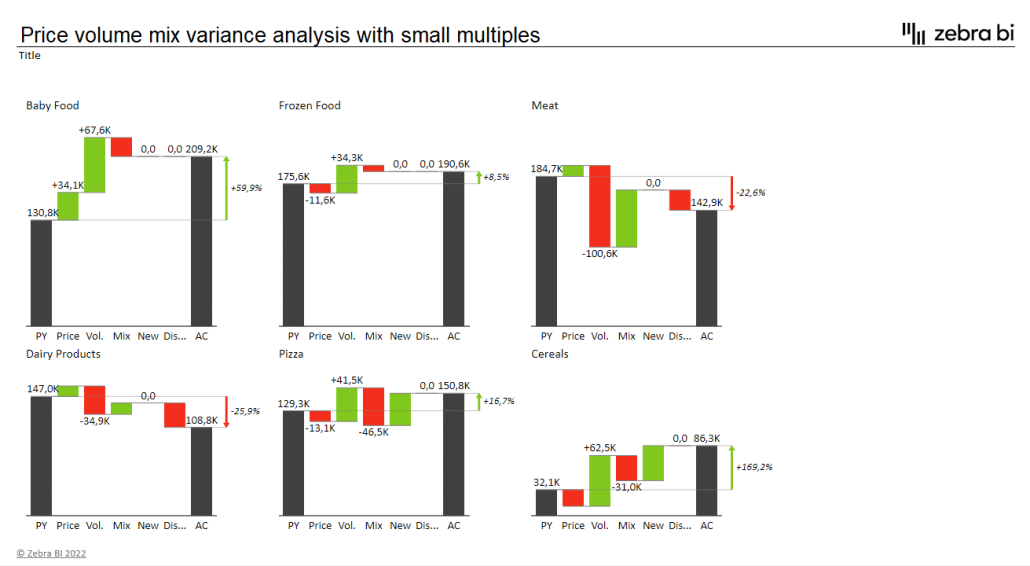
You take the basic data for the previous year, price change, volume, and mix, and do an analysis for all product groups at once. If you're using Zebra BI for Office, the add-in automatically displays such data with small multiples. There is no better way to understand what's going on in your business at a glance.
This Price Volume Mix analysis gives you an insightful overview. It explains the movement for each group very clearly. Are the prices going down or are we selling more? What is happening with our product mix, and are we pushing more profitable products? What is pushing a certain product category forward? These are the types of questions you can now answer.
How do you calculate price volume mix analysis?
Calculate PVM by separating revenue variance into three components: Price Effect = (Actual Price - Base Price) × Actual Volume, Volume Effect = (Actual Volume - Base Volume) × Base Price, and Mix Effect = change in product proportion × margin differences.
What is a CVP chart in Excel
A CVP chart in Excel graphs fixed costs, total costs, and revenue against sales volume to visually show the break-even point where revenue equals costs.
How to analyze price and volume?
Isolate price impact (price change × volume) and volume impact (volume change × price) separately, then use variance analysis or waterfall charts to visualize each component’s contribution.
How do you calculate %CV in Excel?
Use the formula =(STDEV.S(range)/AVERAGE(range))*100 to calculate the Coefficient of Variation, which measures relative variability as a percentage
Now it's your turn!
Create a next-level Price-Volume-Mix Variance Analysis in Excel & impress your C-levels with your extraordinary skills. Get Zebra BI for Office to your Excel for FREE & automatically receive an instructional file that will help you get started.

 September 8th
 February 22nd


Great analysis; however, one major issue....your totals of $41,478 in the "vol" field in your dataset is not accurate. Once corrected, the total in "mix" field is $0. So looks like your analysis is a bit flawed. Any chance, you can get this fixed. I do believe you have a great analysis and this fix should make it useable. Thanks
Hi Sudhir, thank you for your feedback. In the guide is only highlighted one of the methods done with our DEMO data. We are interested to know where exactly is "not accurate"? Otherwise, everything is thoroughly explained step-by-step in the video you can find here https://zebrabi.com/webinar/price-volume-mix-variance-analysis-webinar/. Have you taken a look at it? Just sign up and we will send you the recording. Have a great day.
OK