Build your Price Volume Mix analysis in minutes, not hours
Start your free Zebra BI trial and get the ready-made PVM Power BI template - just connect your data and instantly see how price, volume, and mix effects drive your revenue variance.
 September 8th
 February 22nd
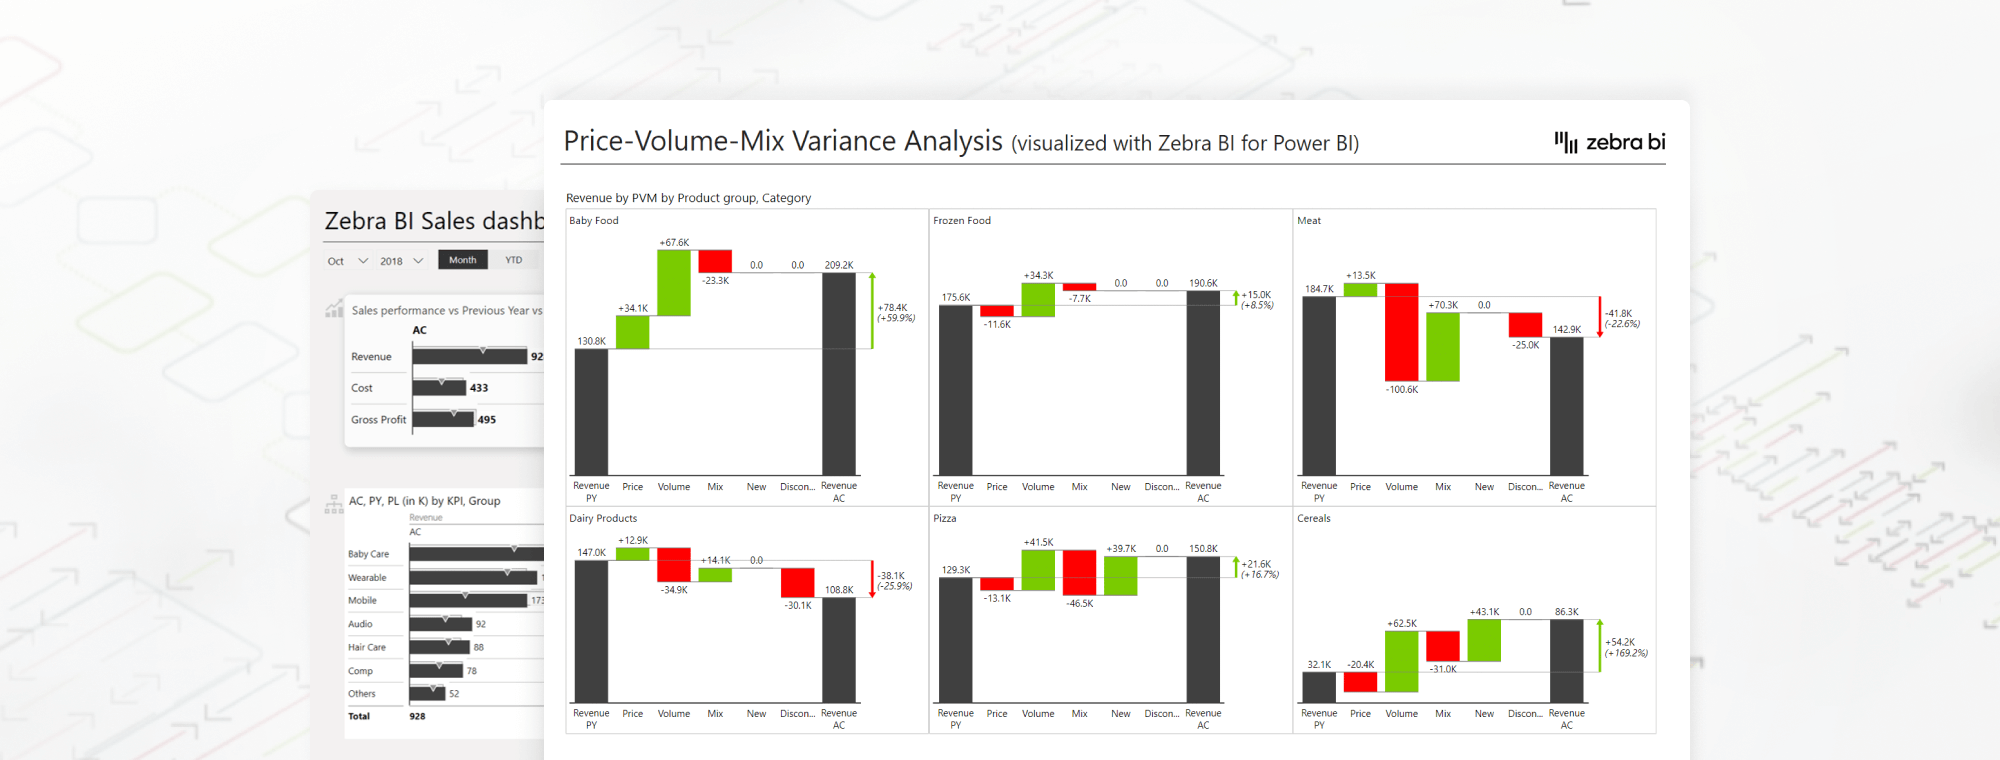
When it comes to your revenue variance, you want to have a complete insight into the factors that drive the changes you are seeing, so you can make informed decisions.
You usually want to look for the most profitable products in your portfolio, the effects your product mix has on your revenue and the state of your margins. The best way to get this done is with a Power BI Volume Price analysis (also known as PVM analysis).
Many businesses struggle with it, particularly when using Power BI. That’s why we’ve created a comprehensive guide to the PVM analysis which will help you add another dimension to your business reporting and thus improve your understanding of your business.
Read on to learn all about creating it by using Zebra BI visuals in Power BI in this complete guide of volume price analysis. If you'd like to jump straight to the template of Price Volume Mix Analysis for Power BI.
This article explores how you can improve your business dashboards by including a Volume Price Analysis. It will help you learn to create rich Power BI reports that tell a compelling story.
We will start by explaining the three core concepts which make up this analysis and show you how to prepare your data for it in Power BI. Next, we will go on to show how to use Zebra BI for Power BI to visualize this analysis. Finally, we will discuss two different approaches to it and show which of the two delivers better results.
Business dashboards usually deal with revenue, gross profits, income and possibly some other KPIs, and compare the current period results to the ones from the previous year, plan, or another target. Working from there, you can start analyzing variances by business units, geographical areas or other measures.
While this is a good start for the base level, you might need more insight to make smarter decisions. This is where the Volume Price analysis comes in. In its most basic version, it shows you how individual factors, such as price changes, sales volumes and product mix affect your revenue.
Let’s take a look at each individual component:
Granted, the Mix category is a bit vague, but it provides very important and compelling insights for successful strategies. It essentially explains how your product mix affects the revenue and helps you build more actionable reports.
For example, you can look at whether the products you’re selling this year are of a higher value compared to last year’s. If the answer is yes, the mix will turn out to be positive. Increased sales volumes of less valuable products, on the other hand, might drag your mix down, resulting in lower margins.
Still trying to explain revenue changes with basic dashboards?
See exactly how price, volume, and mix drive your revenue.
Let's take a look at the price. The price is one of the key factors affecting your growth and performance as a company. The relation is pretty straightforward – price increases usually mean improved performance. Sales volume is another factor driving your company's growth. A growth in volume normally correlates to better performance, unless it is offset by something else.
Take a look at how Zebra BI shows you this data:

Let's review what the visualization shows, and what kind of valuable insights we can draw for data-driven decisions.
It shows that a 5.5% growth in sales can be attributed to different reasons. It then allows you to take a look at what drove the change. For example, increases or decreases in product prices over the past year might have increased the volume or decreased it. What about individual products? Are you selling more items of the same product than last year or fewer?
You can also take a look at the total effect of the volume increases.
Once you get into the Price Volume Mix variance analysis, you can get really creative. Instead of just focusing on previous year’s data, you can analyze the changes in budget. Instead of using revenue, you can use your contribution margins or your gross profit, which will make the story even more powerful. Using the profit, in particular, makes this analysis 10 times or 20 times more insightful.
Understand what's really driving your revenue changes
Build your PVM waterfall chart in minutes - no complex DAX, no manual formatting.
There is also no reason to just use these three categories when analyzing your data for business decisions. After all, your business has more drivers (including, but not limited to market trends and market dynamics)--so going beyond the basic levels is a great idea.
Two typical dimensions you could take a look at are the new and discontinued products. The new products will grow your business and you can do an analysis to identify the revenue that was achieved with just them. Another thing to take a look at is the impact of the discontinued products. These products translate into less revenue in a specific segment. Adding all this data to your analysis can give you a much clearer picture of what impacts your sales.

This is a great example of how powerful this type of analysis can be at driving strategic decisions. At a glance, you can see whether new products are offsetting the revenue lost from discontinued products. You can see the movements in your prices and product volume while also keeping your finger on the pulse of the performance of your product mix.
It is clear that the Price Volume Mix variance analysis should become an essential tool for your business reports. You can use it for ad-hoc analyses or make it a regular part of your quarterly or annual reports. Let’s take a look at how to prepare and organize your data and do these calculations in Power BI.
Go from basic PVM to multi-dimensional variance analysis
Break down price, volume, and mix by product, region, or customer - all in one visual.
Running a Price Volume Mix analysis in Power BI doesn't have to feel like rocket science. We have a simple, effective way to help you do it with Zebra BI for Power BI.
The first thing you need to do is prepare data. In this example, we are using the table imported from Excel, but you can import data from other sources supported by Power BI. These include SQL databases, plain text files, web sources and many others.
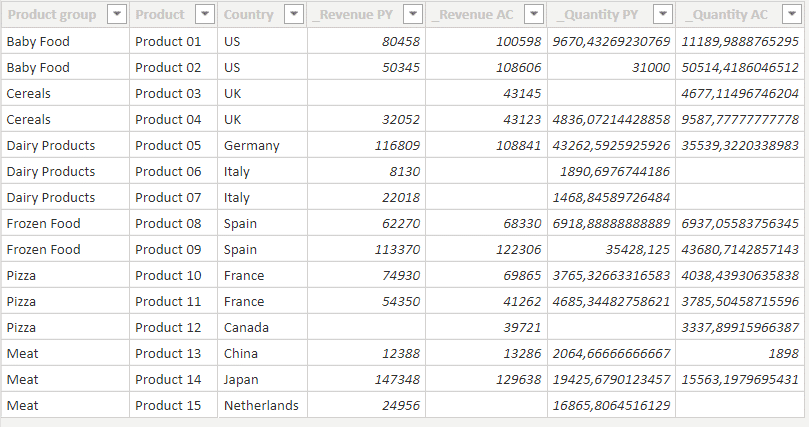
An important thing to do here is to separate your products from this table, especially if you have a sales table with all columns on a single table. An easy way to do this in Power Query is to create a reference to your sales table, rename it and remove all columns but the ones containing products and product groups to create the dimension of products.
When you return to your sales model, you will have your sales table along with a separate product table. Then you need to make sure that the link relationship is one to many. This is how it should look in the end.
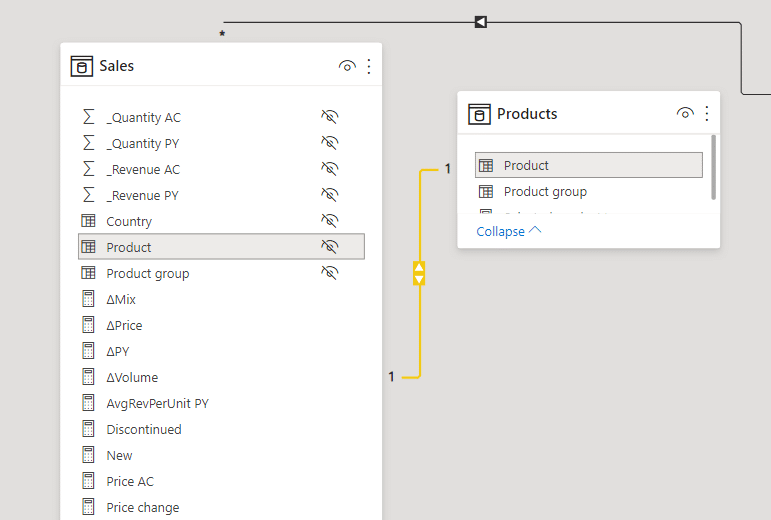
Once we have our separate products table, we have something to work with. In the Fields pane, you have product Quantity and Revenue for the current and previous year. Now you can start calculating your Price field, meaning your average revenue per unit. That is very easy to do. Just divide revenue by quantity and add "zero" at the end. Or - even better - use the blank function here for handling the division by zero.
Price AC = DIVIDE([Revenue AC], [Quantity AC], BLANK())The next step is again calculating the Price change field, which is just the difference between the actual and the previous year's price.
The Price variance gets a bit trickier. Let's take a look at the formula and then go through it step by step.
∆Price = SUMX(Products, IF([Price PY] * [Price AC] <> 0,[Price change] * [Quantity AC],0))This formula takes the price change for every product and multiplies it by the actual quantity. The IF statement is used to check for active products only and exclude any new or discontinued products. Then we use the SUMX to aggregate everything from the product level to all of the hierarchies above that. That is why SUMX is used here with the products table and why it is so important to have a completely separate table for products.
After this, the Volume variance is very straightforward.
∆Volume = IF([Quantity PY] * [Quantity AC] <> 0, ([Quantity AC] - [Quantity PY]) * [Price PY])For the volume variance, calculate the change in the quantity and multiply it with the price for the previous year.
To calculate the Mix variance, you can use the following formula.
∆Mix = ([∆PY]) - ([∆Volume] + [∆Price] + [New] + [Discontinued])After calculating the total variance by subtracting the previous year's revenue from this year's revenue, you simply subtract everything. Subtract the volume change, price change, and new and discontinued products. This provides you with your Mix variance.
Unlock deeper insights with Price-Volume-Mix (PVM) variance analysis—a must-have method for every business analyst. Watch this webinar to learn how to prepare, visualize, and implement PVM in Power BI and Excel using Zebra BI visuals.
And if you want to learn more about the basics Power BI variance analysis (and how to master it), don't hesitate to check out our guide on this as well!
Skip the complex DAX formulas
The PVM template has all measures pre-built - just connect your data.
Now is a good time to use Zebra BI visuals for Power BI to visualize your data for easier, data-driven decisions.
Don't have Zebra BI just yet? Give it a try, for free.
Before you add your Zebra BI visuals, here is a simple trick to make it all easier. As you work with your data, you end up with many separate measures. However, for charts and tables and so on, you can make it simpler by collecting the measures in a single category.
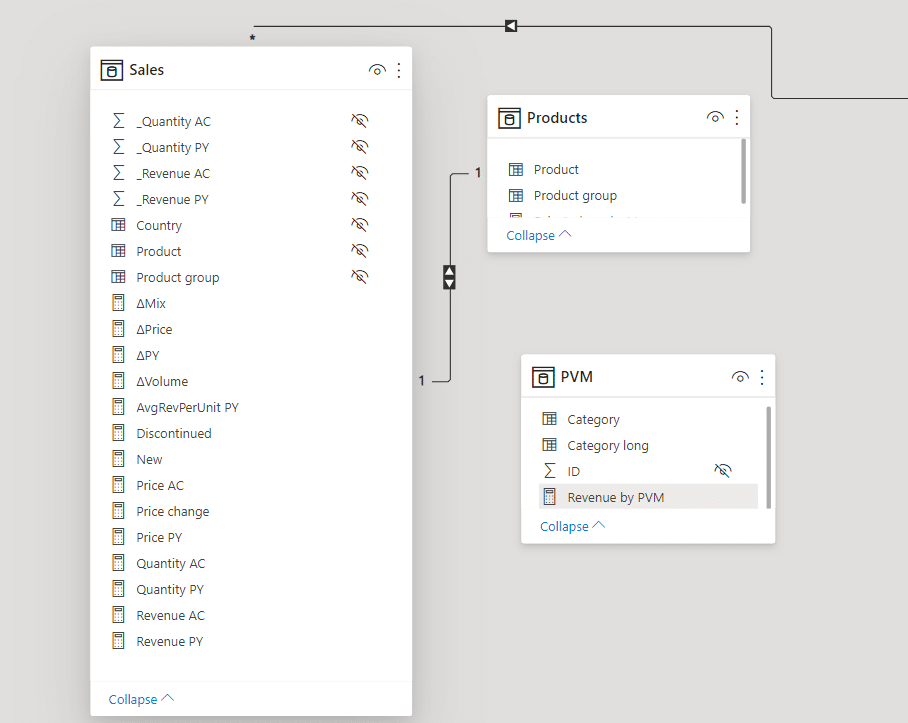
You do this by creating a separate disconnected table which I named PVM. This simple table is not connected to any data and is just a list of values.
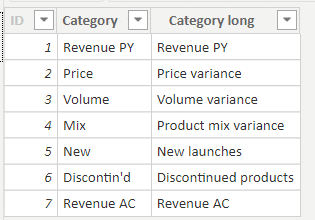
The table contains short and long names of measures and a SWITCH statement is used to transfer the value from those measures into this table.
Revenue by PVM = SWITCH(MAX(PVM[ID]),
    1, [Revenue PY],
    2, [∆Price],
    3, [∆Volume],
    4, [∆Mix],
    5, [New],
    6, [Discontinued],
    7, [Revenue AC])
In this case, the values are transferred from the actual measures. This is just the way to unpivot all the measures and put them into one dimension for easier handling.
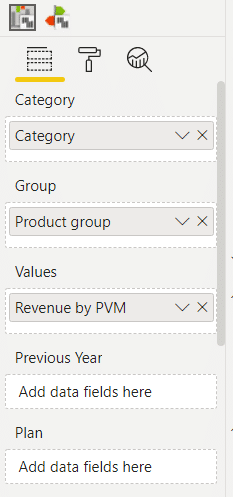
This allows you to take a Zebra BI chart and simply take the Category measure from the PVM table and drop it onto the Category field in your Visualization pane.
This puts all categories on the axis. The only way for this visualization to work, you need to use a waterfall chart. This is very easy to do – simply add a Zebra BI Charts visual, select Revenue by PVM measure, and add the Category measure to the Category field. All that's left is right-clicking on Revenue AC and Revenue PY column headings to mark these values as Results.
If you are using subtotals, you can easily just mark any additional columns as subtotals. This will help you in your analysis.
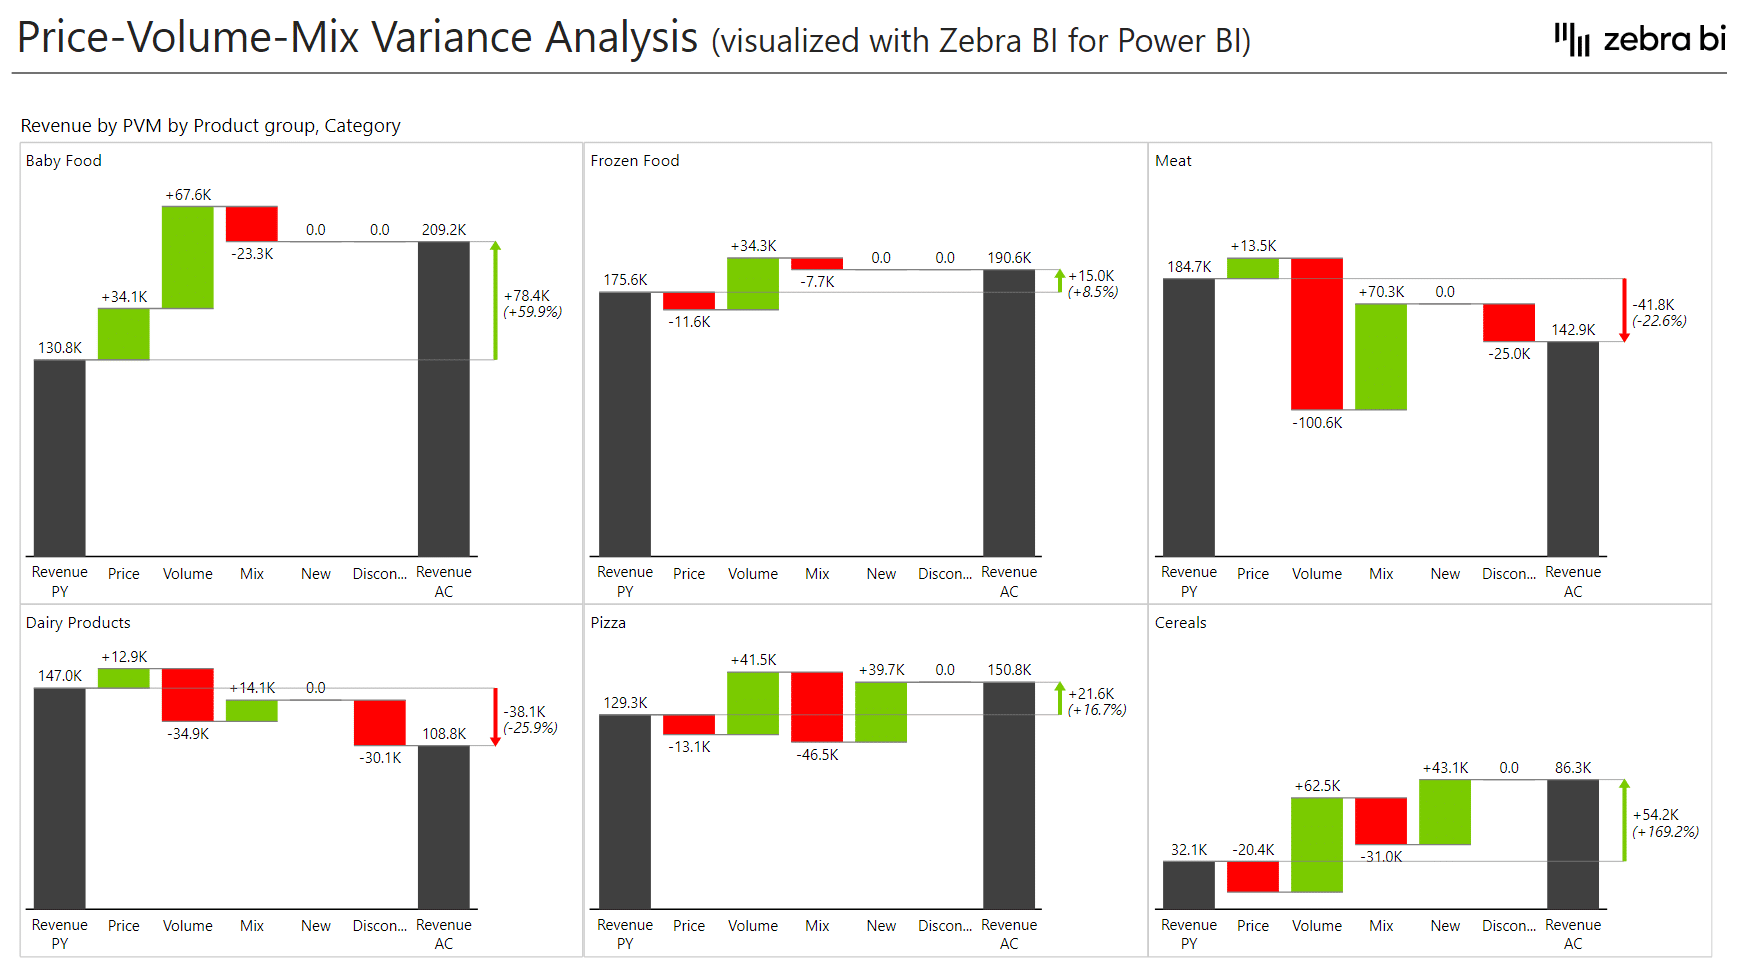
You could also easily create Small multiples by dropping the Product group measure into the group field.
This delivers a great-looking view with small multiples by product groups.
The key to creating a PVM analysis in Power BI is to start by preparing your data. Once your data is ready, advanced visualization tools in Zebra BI for Power BI make it really easy to create analyses that drive engagement and tell a story.
Want to build a powerful Price-Volume-Mix Analysis in minutes? Grab our free Power BI template and transform your finance department into a lean, mean, insights machine.
Zebra BI is the data visualization tool that takes your data from Power BI and transforms it into meaningful and actionable reports that drive informed business decisions for your company, completely removing the need to write code.
A Price Volume Mix (PVM) analysis in Power BI breaks down changes in revenue (or cost) over time into three components: price effect, volume effect, and mix effect. This helps executives understand whether revenue growth is driven by higher prices, increased sales quantity, or shifts in the product/customer mix.
Power BI allows dynamic and interactive visualization of Price Volume Mix analysis (PVM) results. You can easily drill down into data, create dashboards, and use DAX formulas to calculate price, volume, and mix effects — all while sharing insights securely across teams.
For a PVM report in Power BI, you need detailed transactional data for at least two periods (e.g., current vs. previous year), including:
- Product or service
- Quantity sold
- Selling price
- Revenue
- Optional: customer or region for mix analysis
For a PVM analysis in Power BI, you’ll typically use DAX to calculate:
- Price Effect: (Current Price - Base Price) * Base Volume
- Volume Effect: (Current Volume - Base Volume) * Base Price
- Mix Effect: Total Change - Price Effect - Volume Effect
You may also need helper measures for base and current metrics.
The mix effect requires a weighted analysis. In Power BI, calculate it by determining how the proportion of each product or customer group changes between periods and how that impacts total revenue. This is often the most complex part and may require custom DAX or Zebra BI visuals.
Yes. Once your data model and DAX calculations are set up, Power BI can automatically refresh and update your PVM analysis with each data load, ensuring real-time insights without manual intervention.
The most effective visuals for a PVM analysis in Power BI include:
- Waterfall charts (to show price, volume, and mix contributions)
- Stacked column charts (for product or region-level mix)
- Decomposition tree (for drill-down)
- Zebra BI visuals (for compact, business-oriented storytelling)
PVM analysis results' accuracy depends on a variety of factors, including:
- Clean, well-structured data
- Correct base vs. current period definitions
- Careful DAX calculations
- Verifying results against expected business outcomes
Absolutely, you can use a PVM analysis to go beyond sales revenue insights. You can use PVM to analyze costs, profit margins, operational efficiency, or customer profitability. Just switch from selling price to unit cost (for Rate-Volume-Mix), and adjust the logic accordingly.
Common pitfalls of a PVM analysis in Power BI include:
- Mixing up base and current period data
- Incorrect DAX logic, especially for mix effect
- Ignoring currency or unit conversions
- Not filtering for relevant segments (e.g., only active products)