Access the Price-Volume-Mix Excel Template (Included in Trial)
Start your 14-day trial to access the PVM template and follow this guide step by step.
No credit card required · Cancel anytime
 September 8th
 February 22nd
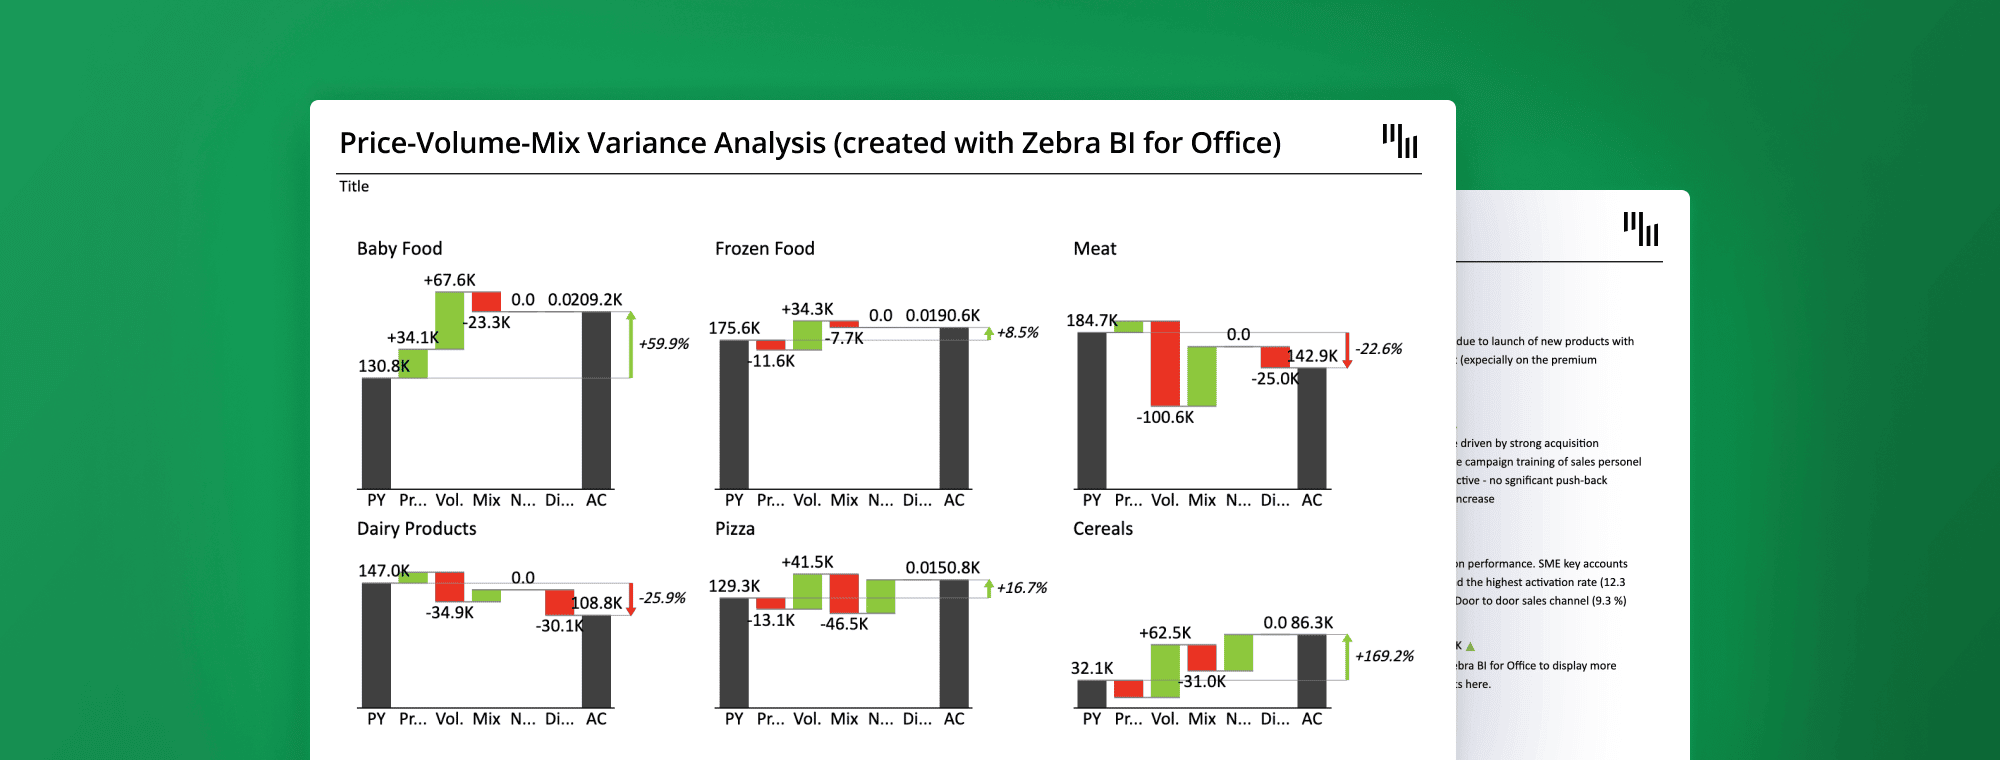
Your business growth is easy to report, but it might be harder to explain.
Did you push a new price in the last quarter, sell more units, or is it a mix of both? Until you know which, you can't tell what's driving the number, or what to do about it.
This is the question most financial reports can’t answer. The numbers tell you something changed, not why.
The effect goes beyond difficult conversations with leadership and investors.
When you can’t figure out that your revenue grew because of price increases while volume goes down, you’ll keep making the wrong calls and build your budget on assumptions that aren’t true.
Price Volume Mix analysis (or PVM analysis) helps you get the right answer. It breaks down your revenue variance into its 3 real drivers.
With a PVM analysis, you can identify the impact of pricing decisions, the number of units sold, and shifts in customer buying behavior.
In this guide, we’ll share how you can do a price volume analysis in Excel, a step-by-step example, and a free template you could use.
Price Volume Mix analysis is a financial framework that breaks down how revenue changes between 2 periods into 3 separate drivers: Price, Volume, and Mix.
It gives you the full picture behind your revenue number, telling you what drove it and whether your business became more profitable as a result.
Let’s take a closer look at each of the 3 components of and how they influence your business revenue:
Price is what you charge for your product at the point of sale. It is the main driver of margin growth in your business, assuming volume stays flat.
However, pricing decisions always come with a tricky balance. Raise your prices too much, and some customers may walk away, which is why the Price Effect never tells the entire story by itself.
The Price Effect (or price variance) measures the impact of changes in the average selling price of your products.
A positive price effect indicates that you generated more revenue by selling your products at a higher price than in the previous period. Usually, this indicates strong pricing power or successful implementation of new pricing strategies.
On the other hand, a negative effect might reveal increased discounting or competitive pressure.
This is the number of units you sell. Selling more products at the same price means more revenue.
Nevertheless, volume has little effect on your profit margins. While raising prices can boost margins, it may cost you volume. This is the trade-off of any price vs volume analysis.
The Volume Effect (or volume variance) measures the changes in the quantity of products sold. The volume effect tells you how much of your revenue change is due to an increase or decrease in overall sales volume.
In PVM analysis, Mix shows that not all products are created equally. Selling more products with higher profit margins drives revenue, and vice versa.
The Mix Effect (or Mix Variance) answers the question: "Are customers buying a more or less profitable combination of products?"
If your sales mix shifts towards higher-priced, higher-margin items, you will have a positive mix effect. If the shift is towards lower-priced items, the effect will be negative, even if your total sales volume stays exactly the same.
The PVM’s drivers don’t work independently, and understanding this makes your analysis a decision-making tool.
For example, a price increase will boost your Price Effect while decreasing the Volume Effect as some of your customers will walk away from a higher price. However, this isn’t necessarily a bad outcome if the margin you gain from a new price outweighs the lost volume.
The same goes for the Mix Effect. Your business can go through declining prices or volume and still see a positive mix if enough customers are now buying higher-margin products.
Or you could have a record sales quarter with no meaningful profit increase if most customers bought your cheapest products. A price volume analysis only covers two of the three drivers.
This is why doing a price volume mix analysis is important. Volume can produce an overall positive revenue, while the price and mix effects are quietly working against your business.
Here are the 3 formulas that you’ll use in any price volume variance analysis:
Price Effect = (Actual Price – Base Price) × Actual Volume
Volume Effect = (Actual Volume – Base Volume) × Base Price
Mix Effect = (Actual Mix % – Base Mix %) × Total Base Revenue
There are 2 common ways to do a PVM analysis:
When using this formula, your Mix Effect accurately highlights any changes in your existing product portfolio.
When doing your PVM analysis, which base period should you use?
Use the prior year's actual to explain year-over-year performance. Use budget to understand why you missed or exceeded your targets.
No matter which formula you choose, make sure you’re using the same base period within a single analysis.
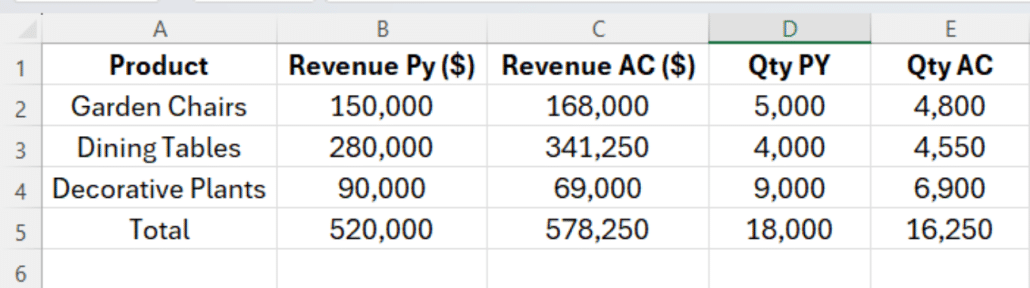
Wondering how to do a price volume mix analysis that shows why your revenue changed? For this example, we’ll keep things simple and create a fictional company that only sells 3 product categories:
The company’s CFO reported a revenue increase of $58,250. For an accurate PVM analysis, you have to know the following metrics: Revenue PY (prior year revenue), Revenue AC (actual current period revenue), Qty PY (units sold last year), and Qty AC (units sold this year).
Once you have the data, you can start the analysis.
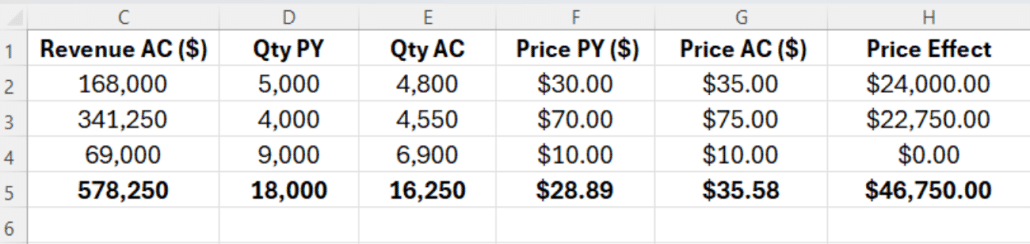
Here’s how to find out how the price change impacted your revenue:
Price Effect = Price Change × Prior Period Volume (Base)
| Product | Price AC | Price PY | Price Change | Qty AC | Price Effect |
| Garden Chairs | $35.00 | $30.00 | +$5.00 | 4,800 | +$24,000 |
| Dining Tables | $75.00 | $70.00 | +$5.00 | 4,550 | +$22,750 |
| Decorative Plants | $10.00 | $10.00 | $0.00 | 6,900 | $0 |
| Total | +$46,750 |
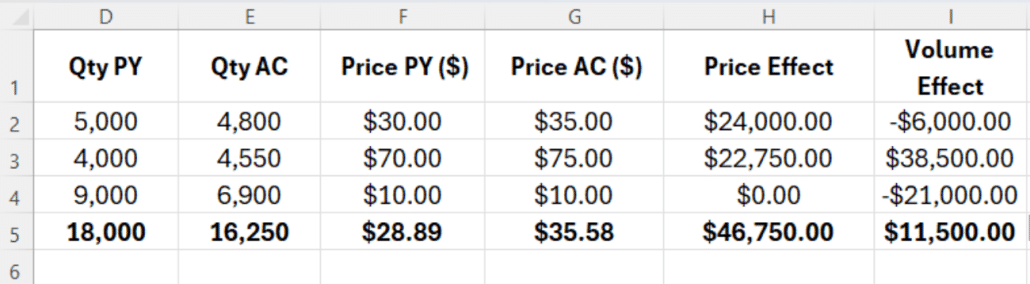
In this PVM example, the new pricing added $46,750 to revenue growth. Garden Chairs and Dining Tables contributed to the increase, while Decorative Plants had no price change, so it had no impact on the Price Effect.
Volume has a big impact on your business revenue.
Here’s how to calculate how much of your revenue variance came from changes in units sold:
Volume Effect: (Qty AC − Qty PY) × Price PY
| Product | Qty AC | Qty PY | Qty Change | Price PY | Volume Effect |
| Garden Chairs | 4,800 | 5,000 | −200 | $30.00 | −$6,000 |
| Dining Tables | 4,550 | 4,000 | +550 | $70.00 | +$38,500 |
| Decorative Plants | 6,900 | 9,000 | −2,100 | $10.00 | −$21,000 |
| Total | +$11,500 |
Volume had a positive effect of $11,500, and the breakdown explains how. Dining Tables accounted for most of its volume and added $38,500 on its own. The growth was partially offset by the loss from selling Garden Chairs and Decorative Plants, which reduced the overall volume by $27,000 combined.
Without the Dining Tables impact, the volume would be negative.
Mix Effect = (Actual Mix % − Base Mix %) × Total Base Revenue
First, calculate each product's share of total volume in both periods:
| Product | Qty PY | Mix PY | Qty AC | Mix AC | Mix Change |
| Garden Chairs | 5,000 | 27.78% | 4,800 | 29.54% | +1.76% |
| Dining Tables | 4,000 | 22.22% | 4,550 | 28.00% | +5.78% |
| Decorative Plants | 9,000 | 50.00% | 6,900 | 42.46% | −7.54% |
| Total | 18,000 | 100% | 16,250 | 100% |
Then multiply each Mix Change by Total Base Revenue ($520,000):
| Product | Mix Change | Total Base Revenue | Mix Effect |
| Garden Chairs | +1.76% | $520,000 | +$9,152 |
| Dining Tables | +5.78% | $520,000 | +$30,056 |
| Decorative Plants | −7.54% | $520,000 | −$39,208 |
| Total | $0 |
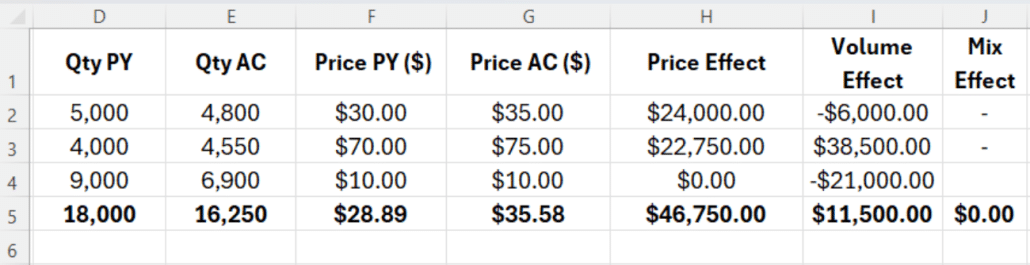
The mix effect is neutral at $0. But that doesn’t mean that nothing changed in the business’s revenue. Instead, it shows how the shifts cancelled each other.
Dining Tables grew its share of the product portfolio from 22% to 28%, which is good news as it is the most expensive product.
Additionally, Garden Chairs contributed $9,152 to revenue growth. However, that gain was offset by Decorative Plants, reducing its share by 7,54% and a $39,208 loss.
All three movements combined to leave mix with no net impact on revenue.
Now, to make sure your price volume analysis is correct, you should calculate the sum of the 3 effects.
Price effect + Volume effect + Mix Effect = Total Variance
46,760 + 11,500 + 0 =58,250
Want to create a Price-Volume-Mix Variance Analysis just like this one?
Get it inside the Zebra BI for Office trial (no credit card) and follow along step by step
Here’s how to do price Volume Mix analysis in Excel from scratch:
Before you start doing any calculations, make sure you have all the relevant data. Here’s the most common information used for a PVM analysis and the right description:
| Column | Description |
| Product | Product name, group, or SKU |
| Revenue PY | Prior year revenue |
| Revenue AC | Actual (current period) revenue |
| Qty PY | Prior year units sold |
| Qty AC | Actual units sold |
If you want a more detailed analysis, add more information. If you have SKU-data level, add it to your PVM Excel analysis. The more detailed your data set is, the more accurate your mix calculation will be.
Add 2 new columns: Price PY and Price AC. For each of your products, divide revenue by quantity:
Price PY = Revenue PY / Qty PY
Price AC = Revenue AC / Qty AC
For the Total row, use the following formula:
Price PY Total = SUM(Revenue PY) / SUM(Qty PY)
Price AC Total = SUM(Revenue AC) / SUM(Qty AC)
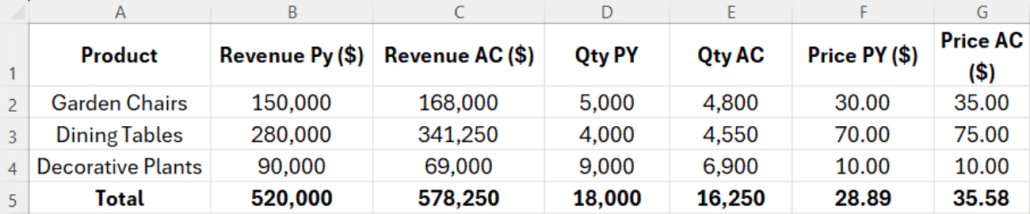
Make sure you divide the revenue by total quantity. Using individual prices distorts your total and throws off every calculation that follows.
Add a new column and name it “Price Effect” For each product row, use the following formula:
Price Effect = (Price AC - Price PY) * Qty AC
This column shows you how much of your revenue came only from pricing decisions.
Add a new column for the volume effect of your PVM analysis.
For each row, enter:
Volume effect= (Qty AC - Qty PY) * Price PY
Add a SUM formula for the entire column to get your total Volume Effect.
To run a correct PVM analysis, use the prior year's price to focus on volume movement.
You cannot calculate the Mix Effect for every product. Instead, calculate it as a residual. For the Total row, use the formula:
Mix Effect = Total Variance - Total Price Effect - Total Volume Effect.
Where Total Variance = Revenue AC Total − Revenue PY Total.
To check if you did everything right, add the 3 effects. If their sum equals the total revenue variance, your analysis is correct.
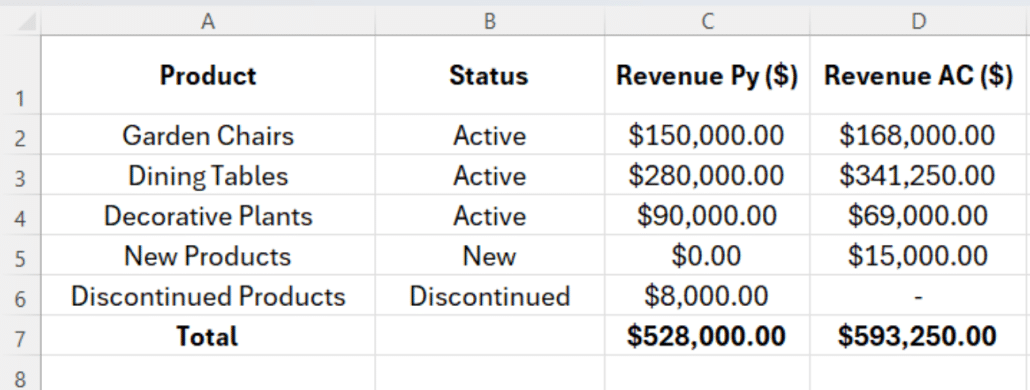
If you launch new products or discontinued old ones, you should treat them separately.
Add a Status column with 3 values: Active, New, and Discontinued.
For Active products, use the usual Price and Volume formulas.
For New products (that you started selling this year), the revenue goes into a New products row.
There is no prior data to compare them against, so you can’t calculate the Price or Volume effect.
For discontinued products (that you sold only last year), the full revenue goes into Discontinued Products as a negative value.
Now, your Mix formula for the Total row becomes:
Mix = Total Variance - Price Effect - Volume Effect - New Products - Discontinued Products
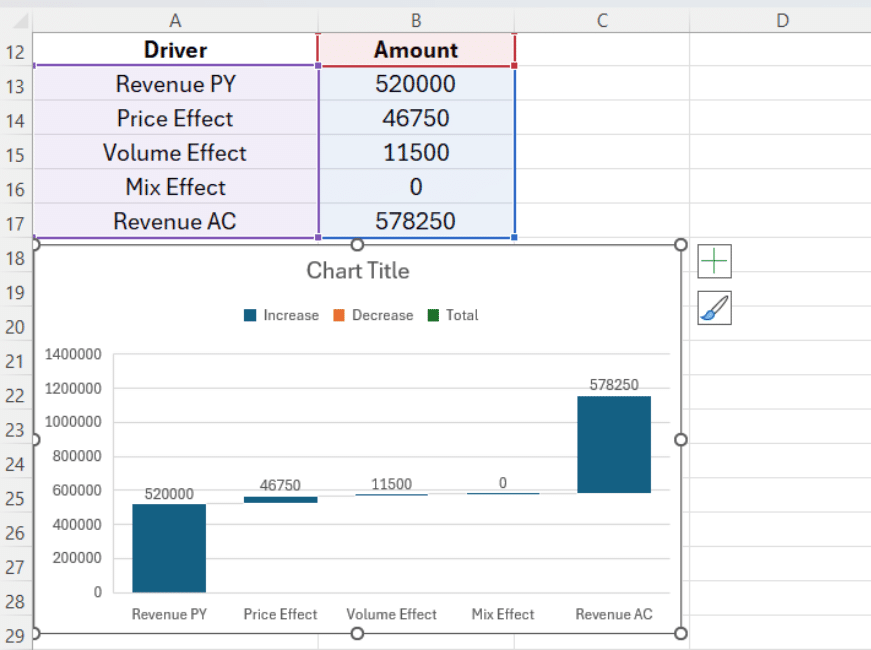
Once you have your data, create a simple table with the revenue driver and each amount.
| Driver | Amount |
| Revenue PY | $520,000 |
| Price Effect | +$46,750 |
| Volume Effect | +$11,500 |
| Mix Effect | $0 |
| Revenue AC | $578,250 |
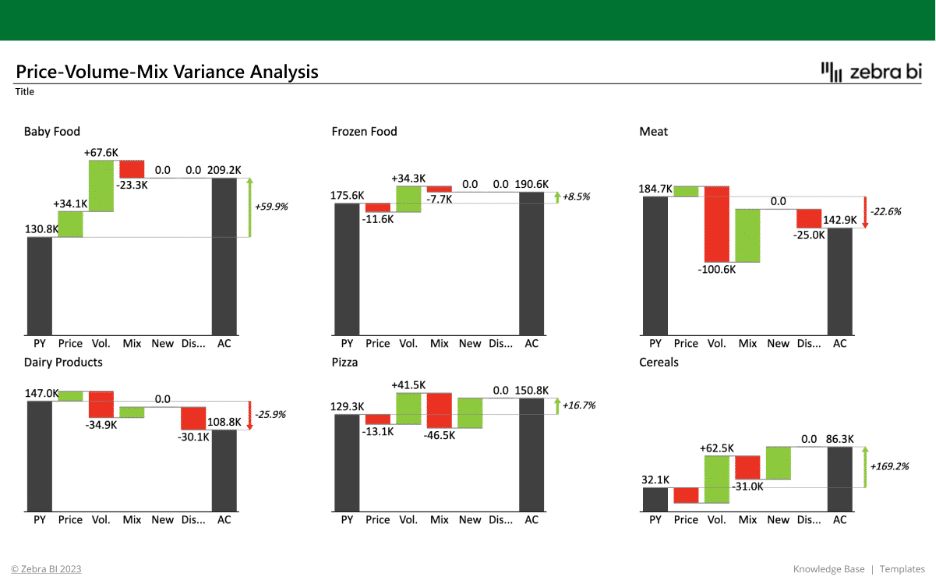
To create a waterfall chart in Excel, select the table and go to Insert -> Chart -> Waterfall. Choose Revenue PY and Revenue AC as the start and end bars and mark them as total.
This gives a clear visual of how your business revenue changed. Instead of reading through a table of numbers, each effect shows its contribution: green for positive and red for negative.
Doing a price volume mix analysis as a financial analyst is only half the job. The other half is knowing what the numbers are telling you and what to do next.
A positive price effect means you successfully increased your product’s prices without losing enough volume to cancel out the gain.
Besides the extra revenue, it shows that your customers value your products or services enough to pay more.
A negative price effect usually indicates discounts or reduced pricing due to competitive pressure.
Was this an intentional strategy? For example, a promotional campaign to drive more volume, or did you have to give away margin to keep your customers happy?
A positive Volume Effect means that you sold more units. This is always good news as long as you didn’t cut down on pricing. A negative Volume Effect means customers' demand for your products or services declined. Usually, lost customers, a new price increase, or market conditions influence the Volume Effect.
Compare the Volume and Price effects to fully understand the trade-off.
The Mix Effect really shows the complexity of a PVM analysis. A positive Mix Effect means that your clients are choosing your higher-margin products, even if you are not selling more units.
On the other hand, a negative Mix Effect, even with a flat volume, means that your customers are moving towards your lower-margin products or services.
This is one of the most dangerous trends revealed by a PVM analysis: everything looks fine on the surface, but your business is becoming less profitable with every sale.
Individually, the PVM’s 3 effect can’t tell the complete story. Here are the most common scenarios and how to interpret them:
| Scenario | What It Means | Best Action |
| Price ↑, Volume ↑ | Strong demand at higher prices . This is the best outcome | Keep pricing range , consider further increases in top-performing products |
| Price ↑, Volume ↓ | Customers are pushing back on price | Evaluate if the price increase was too aggressive or too broad |
| Volume ↑, Mix ↓ | You're selling more, but of the wrong things | Review product mix strategy and sales incentives |
| Mix ↑, Volume flat | Customers are choosing more expensive products | Double down on high-margin products |
| All three negative | Broad decrease across price, volume, and mix | Urgent review needed across pricing, product, and sales |
| Price ↓, Volume ↑, Mix neutral | Selling more at a lower price per unit | Assess whether volume gains justify the margin trade-off |
In retail, a PVM analysis easily shows how revenue changed after seasonal reviews or promotional periods.
If revenue grew, the analysis tells you whether that was driven by higher prices, more products sold, or a shift towards premium products.
If you manage hundreds of SKUs, it shows exactly which product categories are bringing you more revenue and which are dragging you down.
For manufacturers, the most relevant variance within the PVM analysis might be the Mix Effect. A manufacturer might experience flat revenue and discover through PVM that their volumes grew, but their prices dropped to keep their biggest customers from leaving.
With this insight, manufacturers know exactly where they should push back on pricing next time contracts come up for renewal.
For SaaS & Subscription based businesses, “price” comes down to average revenue per user, “volume” means customer count, and “mix” shows the shifts between different pricing tiers. For these businesses, the PVM analysis shows if revenue growth is coming from the right places.
For consumer goods companies, PVM analysis brings clarity as they manage hundreds of products across multiple channels.
PVM analysis gives brand managers and commercial finance teams the visibility to tell the difference between demand growth and volume that’s increasing due to reduced pricing.
Every seat, room, and table has a different value depending on when it’s booked, how it’s booked, and who booked it. Without the price volume variance analysis, this complexity would be impossible to understand and simplify into actionable insights.
Sometimes, costs rise faster than prices, or your mix shifts toward lower-margin items, and your revenue report might miss it.
By the time the damage shows up in the P&L, it’s already months old.
This is why you should apply the same price volume variance analysis to your costs.
Instead of using selling price and revenue in your calculations, you swap in margin per unit and gross profit. The 3 drivers work the same way, and you're just isolating the impact of price, volume, and mix. Now, the results tell you why your gross margin changed over the selected period.
If you don’t want to build the calculations from scratch, you can use Zebra BI’s free PVM template. You can get it inside the free trial (no credit card required).
The template helps finance professionals, FP&A teams, controllers, and business analysts explain revenue changes.
Stop rebuilding PVM every quarter
If your last Price Volume Mix analysis took three days and a tower of nested IF statements, there's a faster way. Our free PVM template is pre-built, drops into Power BI, and refreshes with your data.
Download it inside the free trial. No credit card.
All you have to do is connect your data, and the PVM analysis updates automatically.
-Pre-built PVM formulas with separate handling for new and discontinued products.
-Automated variance to highlight positive and negative movements.
-Automated waterfall chart that breaks down each variance’s impact to your total revenue variance with different highlights and built-in comment markers.
-Zebra BI tables for detailed variance analysis, combining tabular data with integrated charts.
Once you connect your data set, the analysis is ready to share with no cleanup necessary.
PVM stands for Price, Volume, and Mix. The terms represent the 3 drivers used to explain why revenue changed over a specific period.
There are 3 formulas for the PVM analysis:
Price Effect = (Actual Price − Base Price) × Actual Volume
Volume Effect = (Actual Volume − Base Volume) × Base Price
Mix Effect = (Actual Mix % − Base Mix %) × Total Base Revenue
When added, the 3 effects should equal your total revenue variance.
To calculate the mix variance (or effect) in Excel, use the following formula:
Mix Effect = (Actual Mix % − Base Mix %) × Total Base Revenue.
If you need to add your mix as residual, the following formula is more accurate:
Mix Effect = Total Variance − Price Effect − Volume Effect − New Products − Discontinued Products
Price-volume analysis considers only 2 drivers when determining how revenue changes. Price Volume Mix analysis adds a third variance: Mix.
Running your PVM analysis at SKU level gives you more accuracy. If your dataset is too big to work at the SKU level, product groups can also work as long as you’re aware of the limitation.
Yes. You can apply the PVM analysis to COGS and gross margin. Run the revenue and COGS PVM analysis separately, then combine them into a gross margin bridge.
You can get the free price volume mix variance analysis template from Zebra BI. It includes pre-built calculations for all three PVM drivers, new and discontinued product categories, and a waterfall chart that visualizes the results automatically.
Find the drivers hiding in your revenue change.
Revenue changes don't explain themselves. Even when the number's moving the right way, the drivers underneath can be working against you.
Run a PVM whenever you need to explain a revenue change to leadership, build next year's budget, or catch a problem before it hits the P&L.
The sooner you make it a habit, the sooner you start reading your numbers instead of reacting to them.
To skip the manual setup, download Zebra BI's free PVM Excel template: pre-built formulas, automated waterfall chart, IBCS-compliant formatting.
Prefer Power BI? Read our step-by-step guide to building PVM in Power BI for the same clarity in a live dashboard.
Great analysis; however, one major issue....your totals of $41,478 in the "vol" field in your dataset is not accurate. Once corrected, the total in "mix" field is $0. So looks like your analysis is a bit flawed. Any chance, you can get this fixed. I do believe you have a great analysis and this fix should make it useable. Thanks
Hi Sudhir, thank you for your feedback. In the guide is only highlighted one of the methods done with our DEMO data. We are interested to know where exactly is "not accurate"? Otherwise, everything is thoroughly explained step-by-step in the video you can find here https://zebrabi.com/webinar/price-volume-mix-variance-analysis-webinar/. Have you taken a look at it? Just sign up and we will send you the recording. Have a great day.
OK