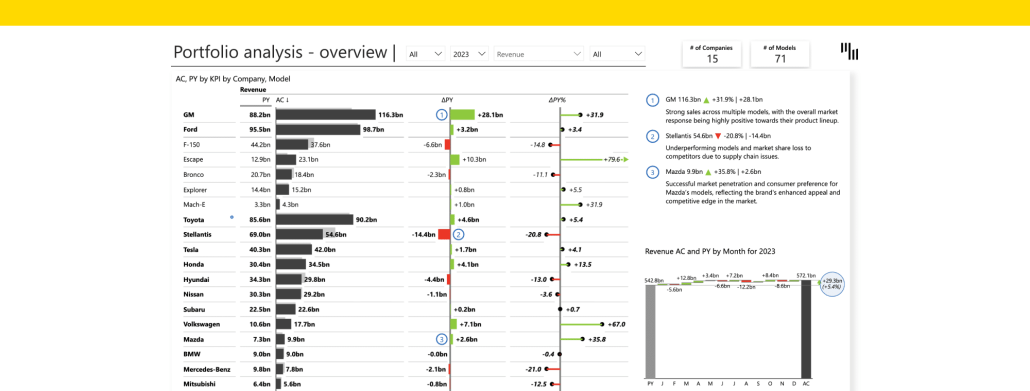
Optimize your automotive brand's performance with our Brand and Product Portfolio Analysis Dashboard. Perfect for executives and strategic planners, it evaluates key metrics like revenue, market share, and sales volume to drive growth.
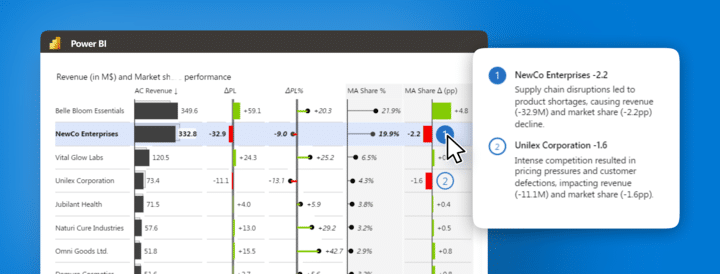
Discover innovative ways the food and beverage industry leverages data visualization and reporting to enhance decision-making and streamline operations.
Improve your data management skills in Power BI by mastering table joins. This guide explains the basics, explores various join types, and provides detailed instructions on using the Query Editor or creating relationships in Power BI Desktop to merge tables efficiently.
Learn to organize and analyze time-based data in Power BI with the date hierarchy feature. This guide covers the benefits and provides a step-by-step process to create a date hierarchy, enhancing your data analysis from years to minutes.
Unlock the power of product portfolio analysis with Zebra BI in Power BI. Learn to visualize and analyze product performance, identify growth opportunities, and drive strategic business decisions with data-driven insights.
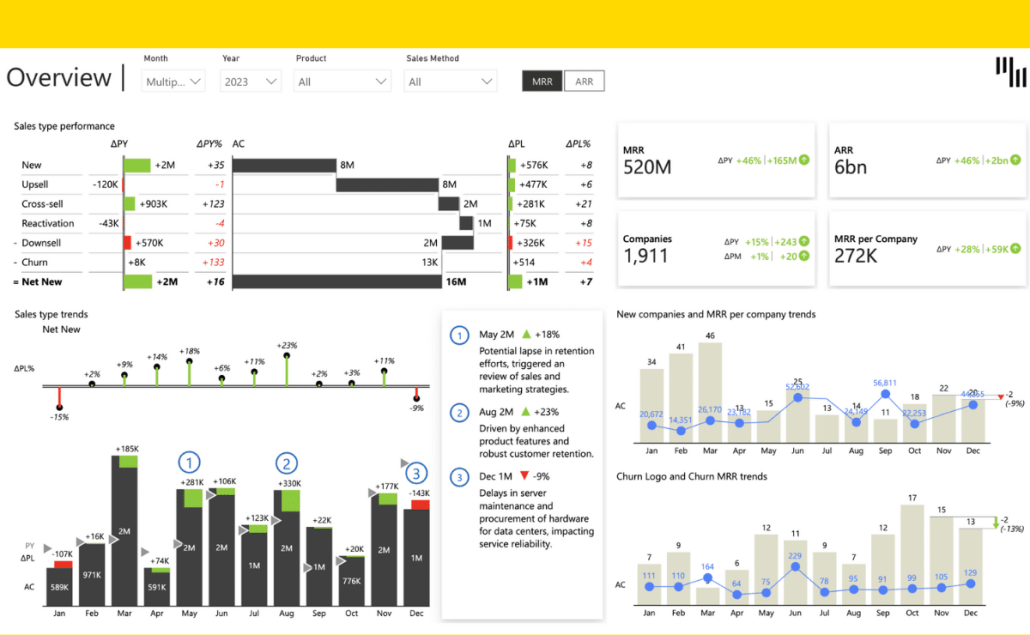
Quickly understand your sales trends with the Zebra BI SaaS Sales Power BI Dashboard. This dashboard provides instant insights into MRR, sales by type, and manager performance, helping you make informed decisions fast.
 September 8th
 February 22nd
 05 Mar 2026