Impact of COVID-19 on the global stock markets – Live Data
PRO Trial
The spread of the novel coronavirus disease COVID-19 has severely impacted the global financial markets.
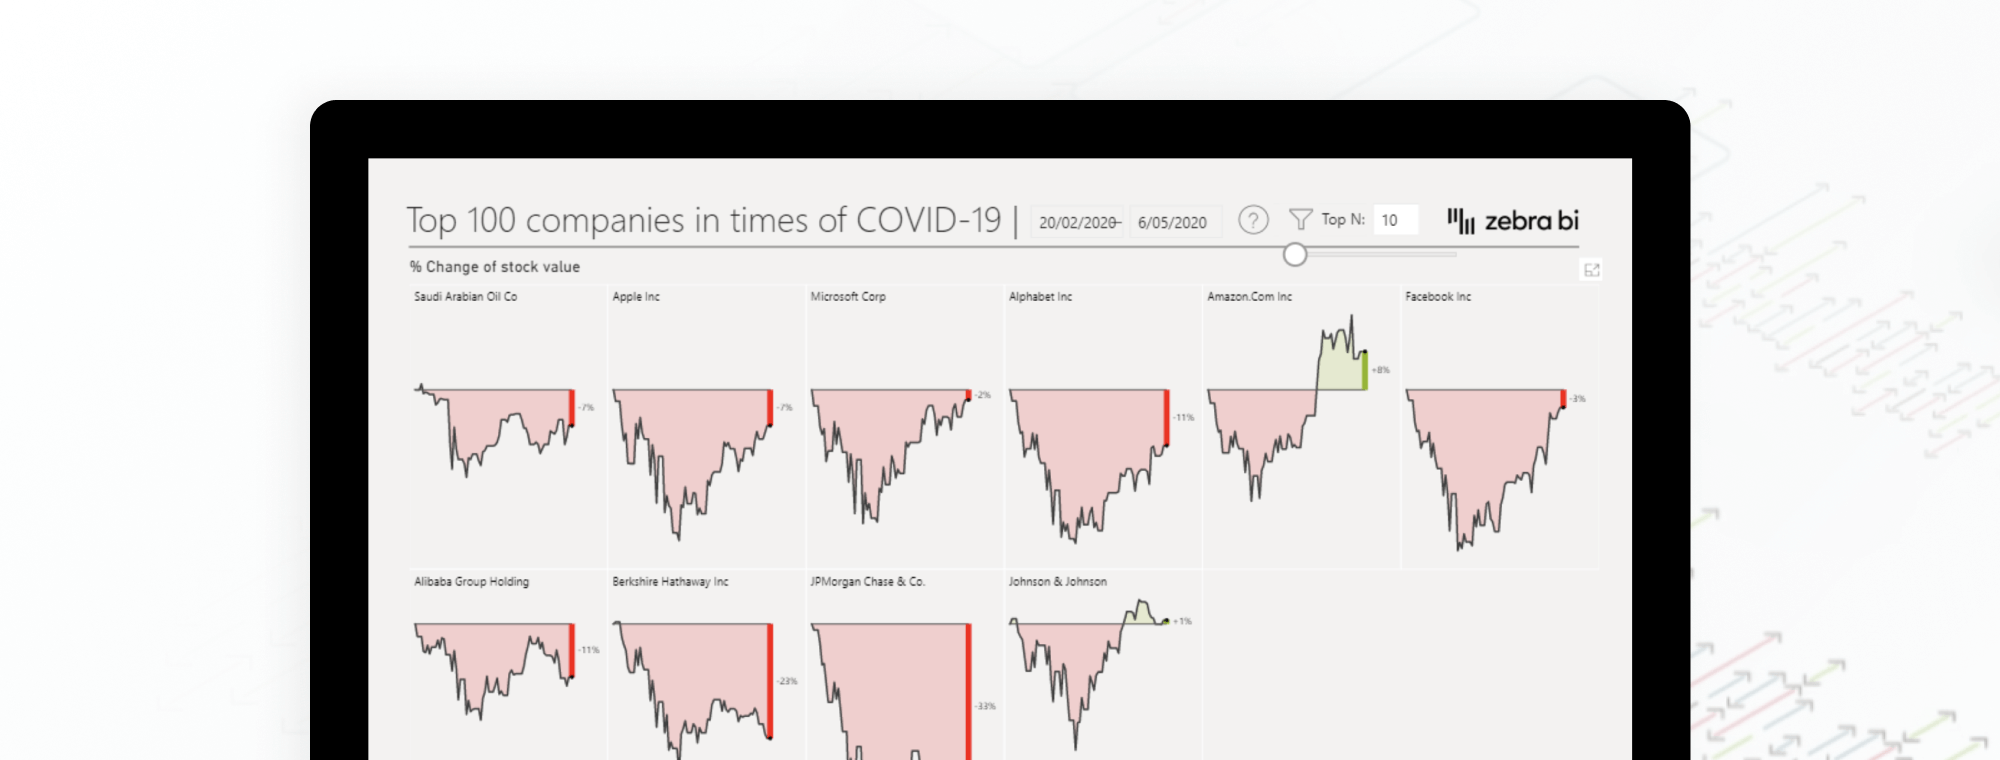
We built an interactive dashboard that shows the unprecedented stock market volatility of the world’s top 200 companies during the COVID-19 pandemic.
[Tweet "The global #stockmarket volatility during the COVID-19 pandemic is unprecedented."]
Play with the dashboard below! Adjust the date range to see the impact in different periods, apply filters to select your preferred companies, click on the company name for details or resize chats by dragging the first gridline in the matrix.
Powered by the amazing Zebra BI visuals for Power BI:
What happened?
The crash started on 20th February and gained momentum by early March with a continuous spread of the pandemic coupled with the global oil price war. In the week from March 9th to March 16th markets registered some of the highest volatility ever.
Paradoxically, although closest to the epicenter of the virus, the Asian markets showed more resilience than their western counterparts. Go figure.
Despite the grim economic data and forecasts, stock markets did regain much of their losses by the end of April. But the new global reality with fears of prolonged recession and limited capabilities of additional government support programs may trigger new waves of high volatility. Keeping our fingers crossed to see everyone in the green again soon!
Source data: Yahoo Finance
Want to add this interactive dashboard to your website?
We believe in the free flow of information. Simply copy and paste the embed code below: