Fabric handles the first 99 miles. ROI happens at mile 100. See how Zebra AI turns Microsoft Fabric data into executive-ready decisions - automatically.
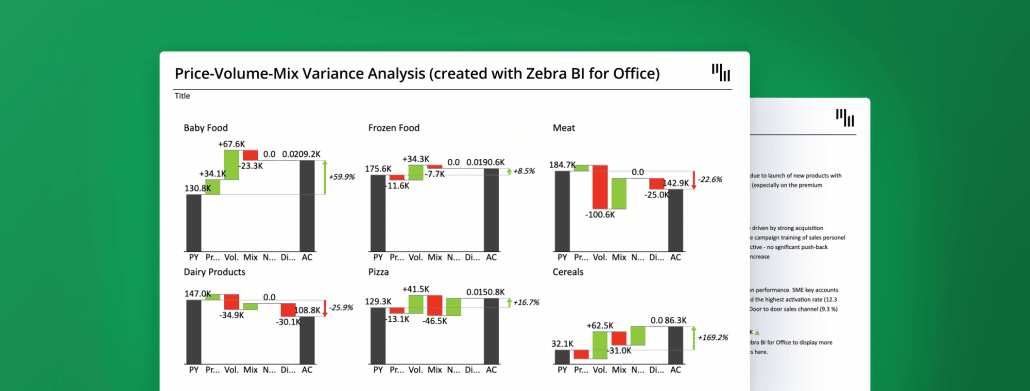
Ready to take your Power BI waterfall charts to the next level, the easiest way there is? Follow our guide for better custom visuals done in less time and with less hassle.
Traditional reporting is broken. The good news? You can future-proof your financial reporting (easily). Here's a quick webinar overview on this specific topic, click to learn more about modernizing financial reports, from our Senior BI Consultant, Mark.
Not sure where to start with your Power BI sales dashboard or how to optimize it? Here is a comprehensive guide that will help you make the most out of your sales data!
 September 8th
 February 22nd