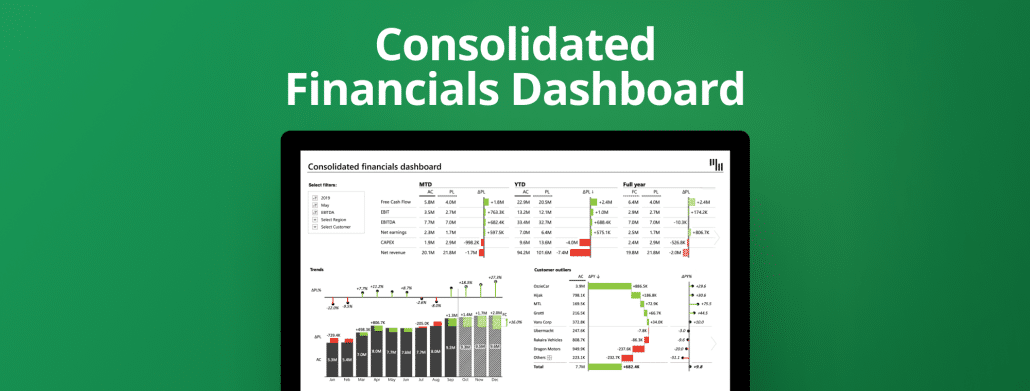
This advanced template brings a complete overview of your financial performance. You can see the complete overview of different KPIs, trends, and customer outliers. For more details use filters and immediately see what you're looking for.
Use this template to understand the main KPIs of your business: revenue, costs, and profit. For better analysis compare them to plan and analyze the trends over time.
Use this template to visualize your P&L in Excel with multiple levels using expand & collapse functionality in a table with integrated charts. Get the right context with automatic variances & up to three comparisons.
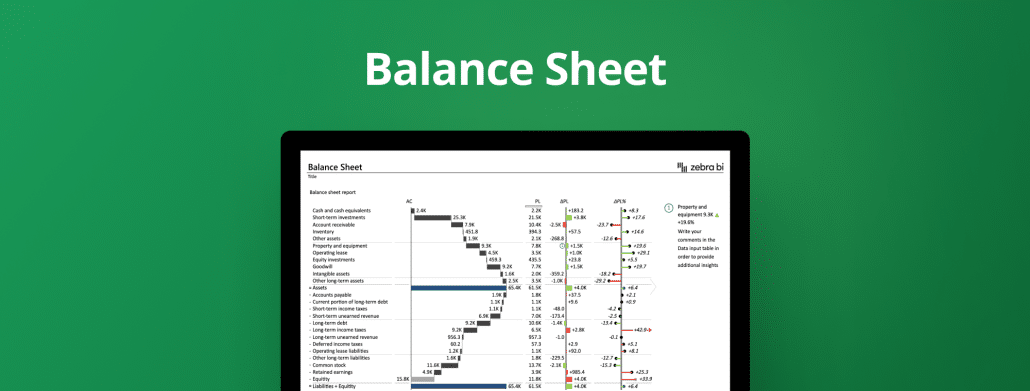
Visualize your company's financial position with table with integrated waterfall chart, custom calculations for invert & result, dynamic comments & automatic variances so that everybody know what is going on & why.
Create an Income statement (P&L) in Excel using a bridge chart, custom calculations (e.g., invert, result), dynamic comments, and automatically calculated variances.
Use this template to visualize your EBIT contribution analysis with a bridge chart directly in Excel. Automatically calculated variances & dynamic comments provide even more insights for you & your managers.
Visualize how Cash Flow from Operations, Investment & Finance contributes to Net cash flow by using a table with integrated charts, comparing actual to plan & previous year, and showing more insights with dynamic comments.
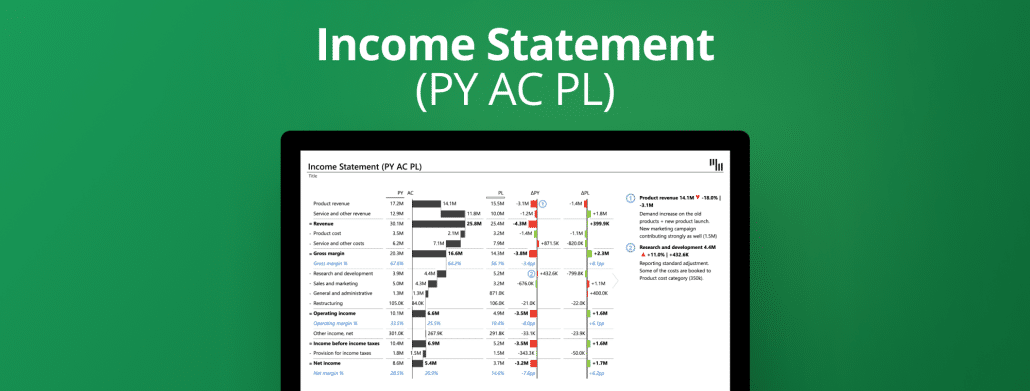
More advanced income statement comparing the actual value with the previous year and the plan in a table with an integrated waterfall chart, custom calculations, and more!
Visualize your P&L in Excel by comparing your actual value to the previous year using a table with integrated waterfall chart, custom calculations, automatically calculated variances, and more!
 September 8th
 February 22nd
 26 Mar 2026