Explore
Products
Zebra BI for Power BI
Zebra BI for Excel
Zebra BI for PowerPoint
Live Demo PBI
May 16, 2024
Live Demo Office
April 25, 2024
On-demand Product Tour
Resources
Zebra BI Academy
Resource Hub
Customer Stories
Templates
Webinars
Guides
Help
Help Center
Knowledge Base
Beginner's Guide
101 Crash Course
Chart Selector
Support
Why Zebra BI?
Our customers
Actionable reporting
Supercharge your Power BI
Calculate return on investment
Pricing
Search for:
Login
Try Zebra BI for free
Products
Zebra BI for Power BI
Zebra BI for Excel
Zebra BI for PowerPoint
Live Demo PBI
May 16, 2024
Live Demo Office
April 25, 2024
On-demand Product Tour
Pricing
Resources
Zebra BI Academy
Resource Hub
Customer Stories
Templates
Webinars
Guides
Help
Help Center
Knowledge Base
Beginner's Guide
101 Crash Course
Chart Selector
Support
Why Zebra BI
Our customers
Actionable reporting
Supercharge your Power BI
Calculate return on investment
Log In
Try For Free
Close
Upcoming webinar:
How to make your Power BI reports run up to 10x faster
September 8th
Register
Zebra BI Live Product Demo:
Start creating truly insightful Power BI reports and dashboards
February 22nd
Save the spot
Home
Resources
Category:
Reporting
Category:
Reporting
Power BI
Guide
January 27, 2021
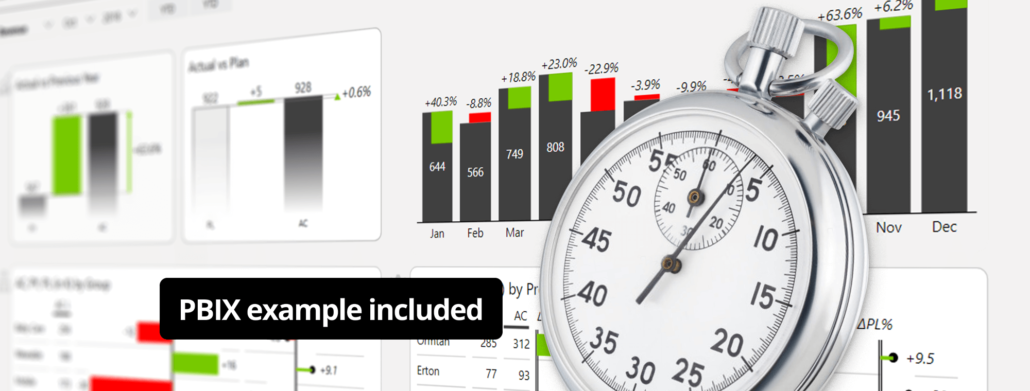
Power BI Productivity Features: Build your reports amazingly FAST!
This tutorial outlines some of the best practices and step-by-step Power BI productivity features that work like magic. Themes, templates, and more.
Read more
Power BI
Guide
November 12, 2020
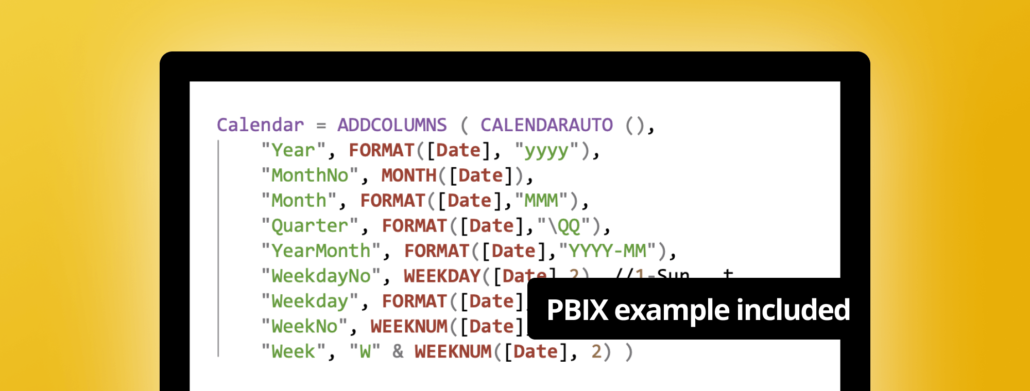
Top 5 Power BI DAX tricks for super effective Power BI dashboards
Learn 5 powerful Power BI DAX tricks to take your Power BI reports and dashboards to the next level. Includes follow-along PBIX example.
Read more
Power BI
Guide
October 26, 2020
How to Create Dynamic Comments in Power BI: How to Start
Commenting can make or break your Power BI reports. We will show you basic & advanced ways of commenting to make your life easier.
Read more
Power BI
Guide
October 23, 2020
Dynamic Comments in Power BI
Learn everything about dynamic commenting, different methods of commenting, its features, and usability in reporting.
Read more
Power BI
Guide
July 30, 2019
Custom Power BI Visuals Can Turn Your Reports Around
Power BI provides practically anyone with a powerful tool, to explore data and find insight. Find out how to make use of its functionalities.
Read more
Power BI
Guide
August 8, 2018
Mastering Variance Reports in Power BI
We explained the different types of variance reports and how to set them up in Microsoft Power BI to make reports clear and easy-to-understand.
Read more
Power BI
Excel
Guide
August 18, 2016
Difference highlight: the fastest way to improve your reports and dashboards
Good data visualization removes all unnecessary items and emphasizes the important values. One of the best tools for this is a difference highlight.
Read more
Excel
Guide
July 7, 2016
How to create interactive reports and dashboards in Excel
Updating your monthly, weekly and daily reports in Excel can be a tedious task. Fortunately, you can use some of the native Excel functions to automate it.
Read more
Excel
Guide
August 13, 2015
How to Choose the Right Business Chart - A 3-step Tutorial
In this article we will explain how to choose the right chart for your data. Or more precisely, for your message.
Read more
Pagination
1
2
»
Product
Zebra BI for Power BI
Zebra BI for Excel
Zebra BI for PowerPoint
Latest Releases
Changelog
Zebra BI for Power BI Pricing
Zebra BI for Office Pricing
Resources
Webinars
Templates
Guides
Zebra BI Academy
Blog
Community Events
Legal documentation
Help
On-demand product tour
Live product demo
Knowledge base
Beginner’s Guide
Zebra BI 101 Crash Course
Chart Selector
Company
About
Careers
Customers
Become an Affiliate
Find a Partner
Terms of Website Use
Contact Sales
Technical Support
© 2021 – 2024 Copyright Zebra BI d.d. All rights reserved. Various trademarks held by their respective owners.
Privacy Policy
Legal documentation
Try it in your Excel. For free.
angle-up
angle-down
youtube-play
question-circle-o
dropdown-down
TimelineArrow
arrow
download
facebook
ln
logo-black
menu
no
search
twitter
 September 8th
 February 22nd