Try Zebra BI for FREE - add writeback comments to Power BI the easy way
Zebra BI gives you dynamic, filter-responsive comments built directly into your Power BI visuals. No complex setup, no maintenance - just comments that work.
 September 8th
 February 22nd
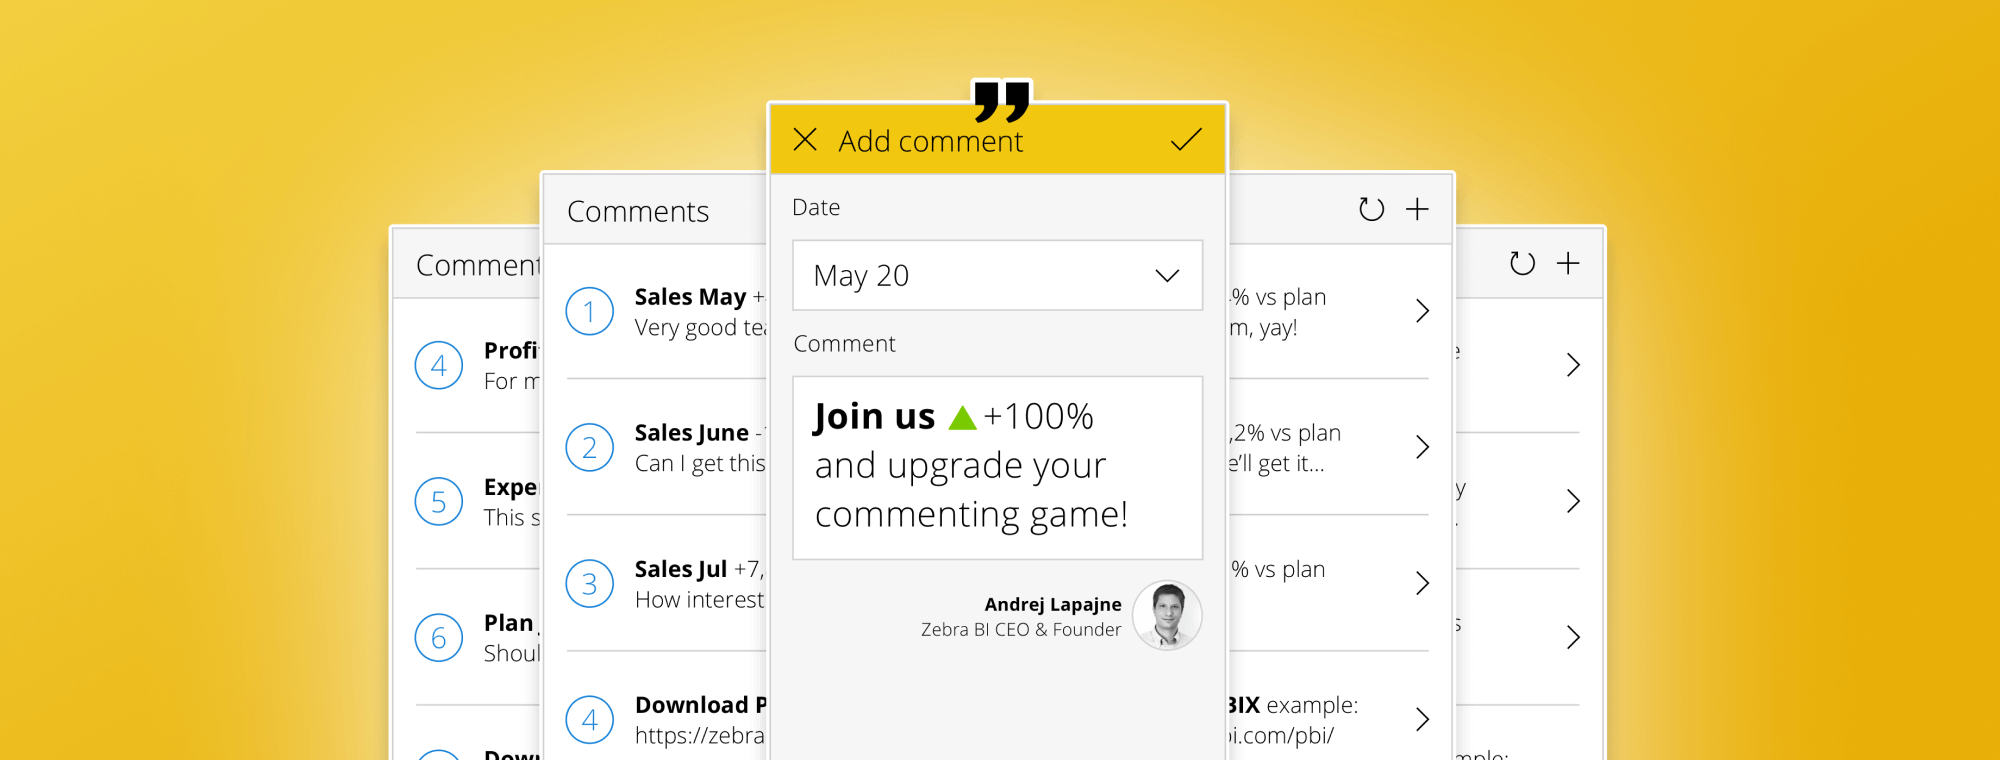
This guide covers the Power Apps method for writeback comments in Power BI. Since then, Zebra BI has introduced a native dynamic comments layer that achieves the same result in one click - no Power Apps required. If you want the simpler route, jump straight to the solution
In this post, we'll look at how you can add dynamic writeback comments to your dashboards with Power Apps, allowing users not just to add dynamic comments but also to write back their feedback directly in Power BI. This will require you to have a Microsoft account for using Power Apps.
The number one question we get when doing our webinars is: “Can you talk more about this option of writing the comments back from Power BI?” We heard you and today we’ll explain how you can use Power Apps to do writeback comments in Power BI.
This is a step-by-step tutorial to demonstrate the whole process from a blank Power BI report to a fully functioning solution of write-back commentary.
Want writeback comments without the Power Apps setup?
Zebra BI adds dynamic comments to Power BI in one click - no Power Apps, no Excel tables, no connectors needed.
It’s no wonder there is so much interest in this topic. Comments are conspicuously missing from Power BI dashboards and reports. It is actually an odd omission. Dashboards and reports often contain a lot of charts, tables, and numbers, but they typically don't have qualitative information, such as short explanatory texts that would be integrated inside a report or a dashboard.
Let’s take a look at an example. Here is an executive dashboard with comments:
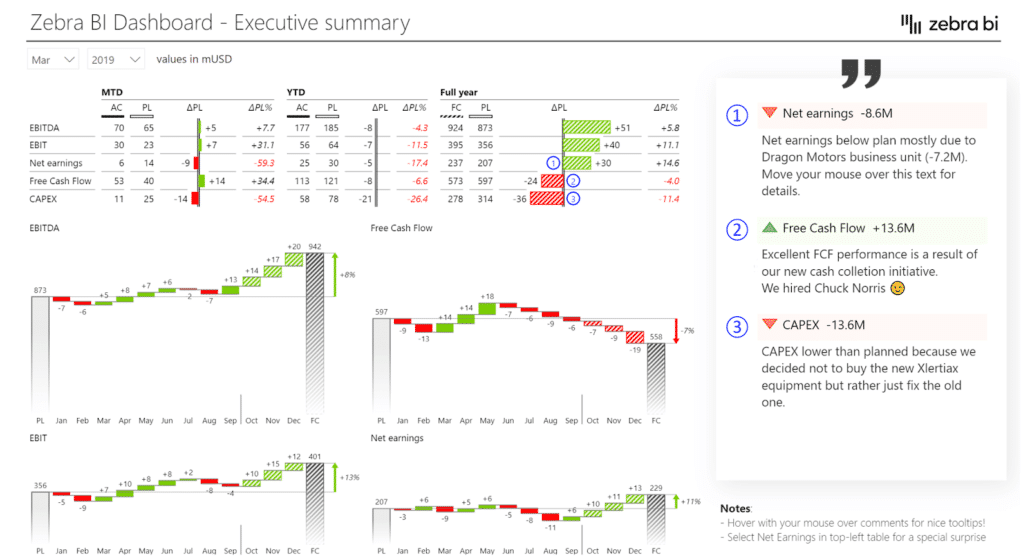
On the right side, you can see three comments explaining why certain KPIs are below or above the plan. Short comments like this can add a lot of insight to existing Power BI dashboards and reports. The management in particular will be glad to have an opportunity to read meaningful explanations of what is going on inside their data.
Of course, these comments should be just as interactive as the rest of Power BI. This means that if you use the slicer to switch between months or years, comments should change as well.
And to make things truly interactive, we’ll also look at how you can use Power Apps to add writeback comments directly to a Power BI page. This is actually a very nice feature that is really flexible and easy to use.
Here is what it looks like in practice.
Since this is HTML, users can even format the text and make parts of it colorful, bigger or smaller.
Step one is to create a table for storing the comments. It can be an Excel spreadsheet, an SQL database, or something else, as long as it’s located in the cloud where people can connect to it. Power BI is very flexible. For example, if you decide to use Excel, you can upload it to OneDrive or SharePoint.
In step two, you include this table in your Power BI model and create relationships. You can either load this into your Power BI project or use DirectQuery. The latter has the advantage of automatic refreshing. When someone enters a comment, the whole project is automatically refreshed so that the new comment is reflected across all the pages of the report.
The last step is to build the Power App. In this tutorial, we will build the actual app with the screens and enable users to enter data into your application.

For your comments, you need to create a table with at least two columns. The first column is of course the column that stores the text of your comments. However, you probably want to relate those columns to time values, which enables you to do things like switch between time periods with a slicer. For example, when you switch between months, comments change as well. This data goes into the second column.
You can also add other relationships to make sure your comments refer to specific KPIs or specific business units or something else. If you need that, you simply add additional columns and use them to create relationships in your data model.
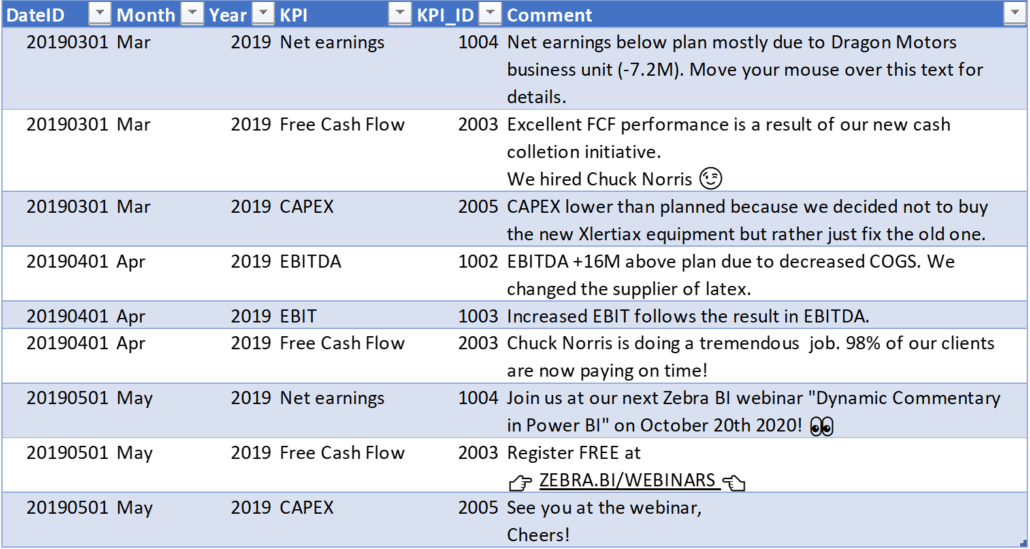
Here is an example of a table with comments relating to dates and KPIs.
After you have your comments table, place it within your data model. The best way is to use it as just another fact table with relevant relationships. These relationships are necessary so you can filter your comments. If you have a time dimension in your comment table, you should create a relationship to your calendar table. If you want to use business units to filter the comments, just create another relationship with that table. These relationships can help you make comments more dynamic and interactive.
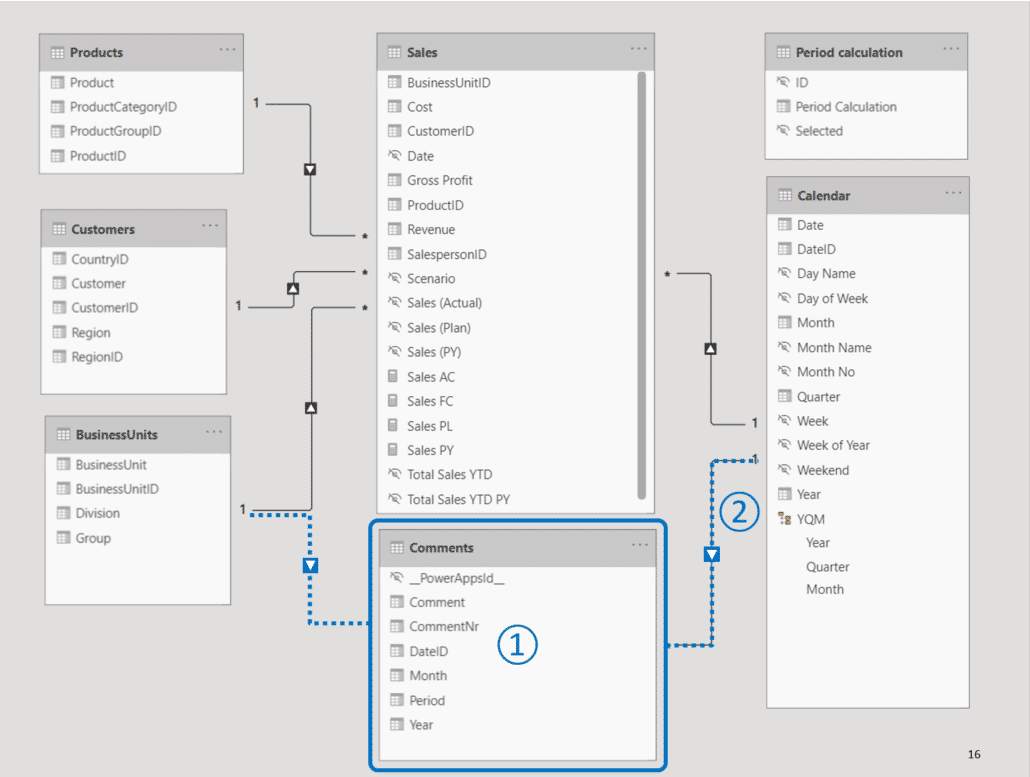
This is a very important point. If you have used Power Apps before, you're probably used to logging into Power Apps to start creating your app there. However, if you want filtering to work, you need to start in Power BI.
To reiterate: Create your Power BI app from report and move to the Power Apps Studio later.
Insert your Power Apps visual, add your data fields and create the app from Power BI. Afterwards you continue work in the Power Apps studio, where you build the application and add the elements and interactivity you need.
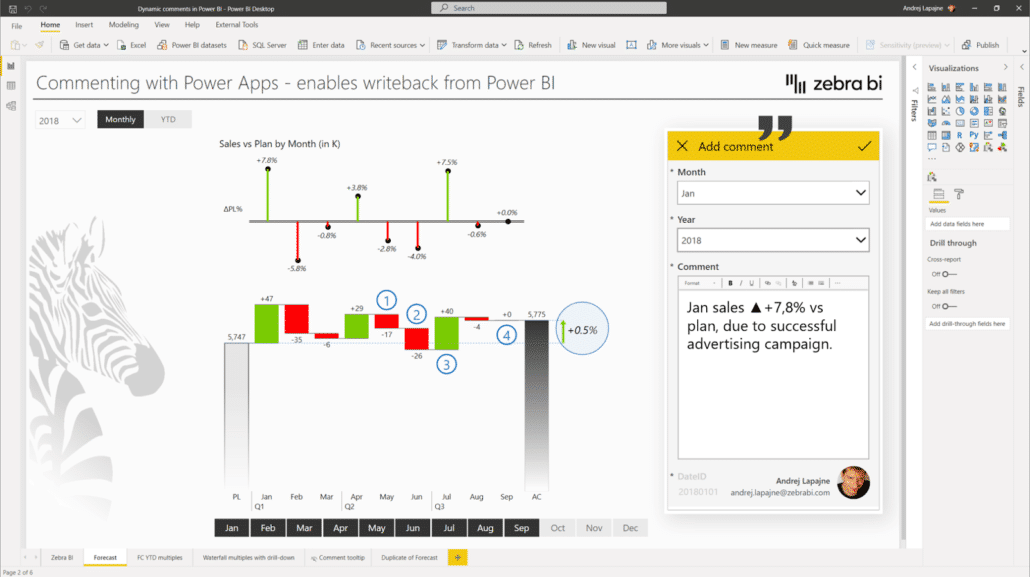
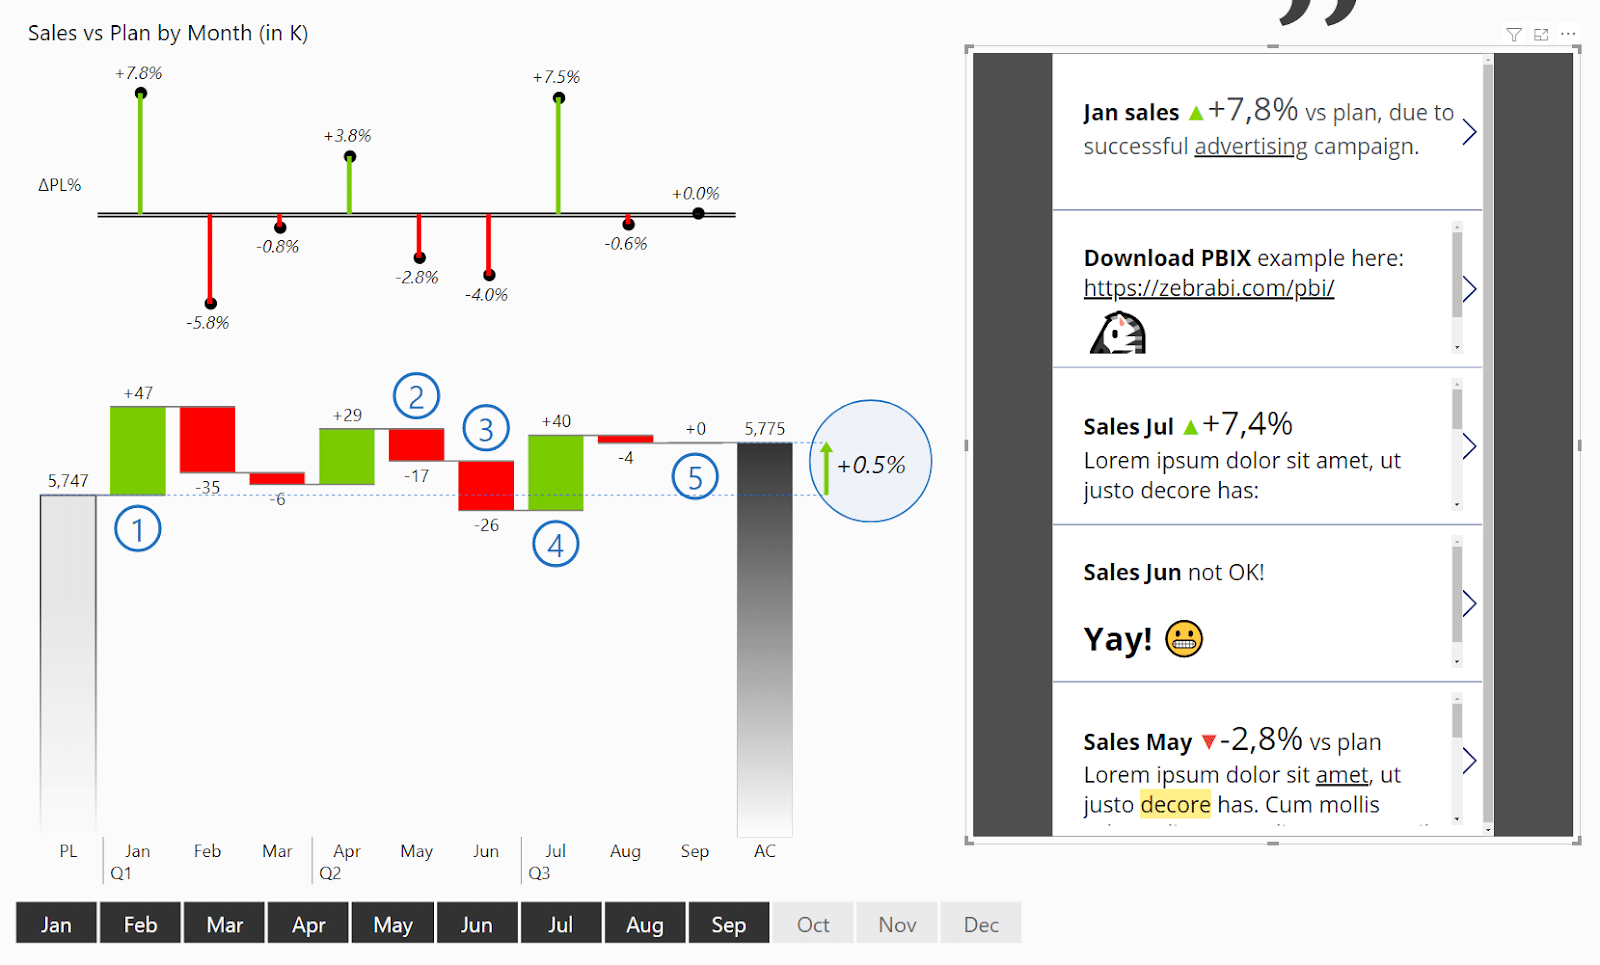
Let’s start up Power BI and take another look at what we’re trying to build.
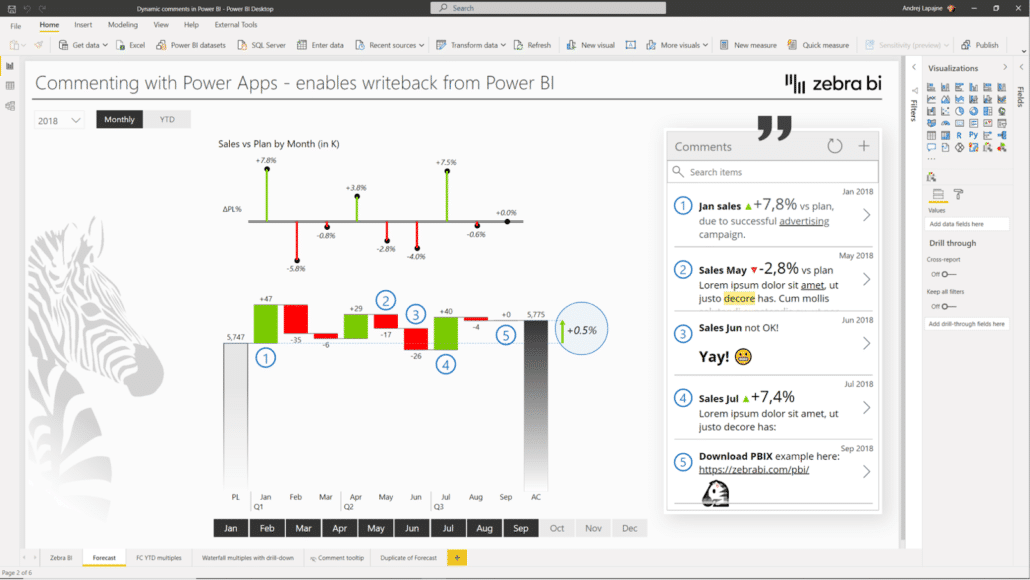
These comments change dynamically when you switch between years using the slicer. We’re also using HTML, so you can format the text and make it bold, add emojis and links and so on. Since we are working with writeback comments, you can also write your own. Once you click Submit, the comment is sent to an Excel spreadsheet hosted on OneDrive.
If you look at your follow-along Power BI file, you can look at the Comments table in the Data view.
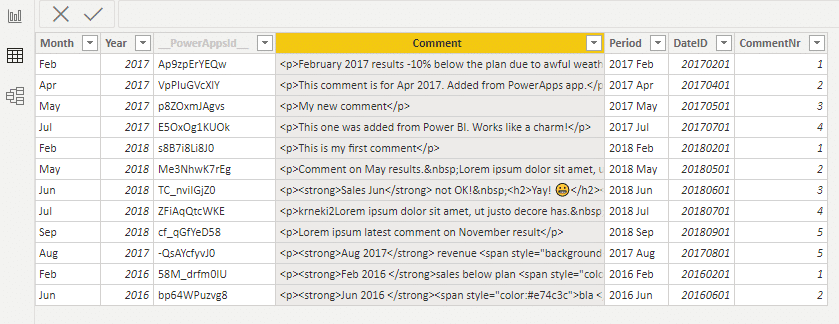
There should be some comments in there already. They may look a bit strange but that’s just because they contain HTML and corresponding tags.
Other columns include month, year, and date ID, which help with filtering comments and showing them in the correct views.
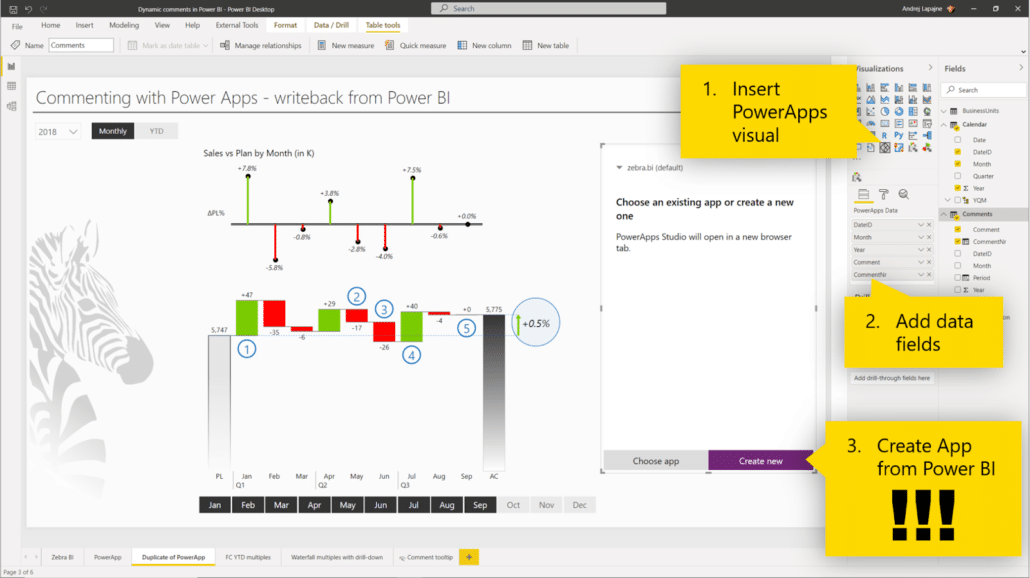
Return to the Report view and add the Power Apps visual to your report. The Power Apps visual is located in the Visualizations pane on the right side of the screen.
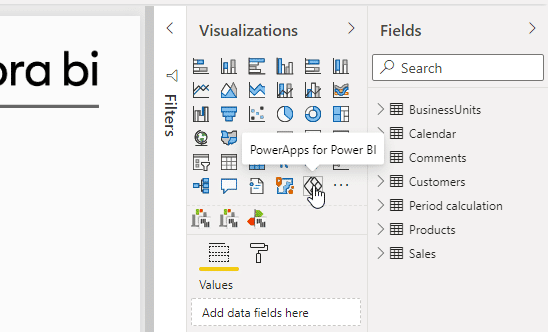
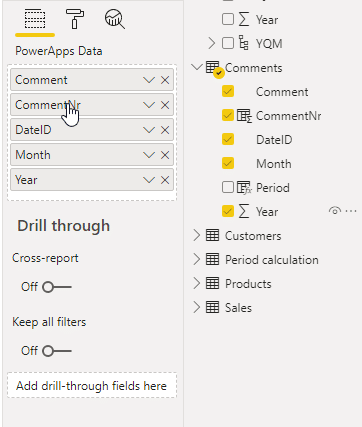
Once you have your Power App visual, click on it and add all the fields you need. In this case, let’s add comment, comment number, date ID, and month and year as separate columns. You should plan the fields you add carefully, because once the Power App is created, you can no longer change the fields.
After this, just click the Create new button in the Power App visual.
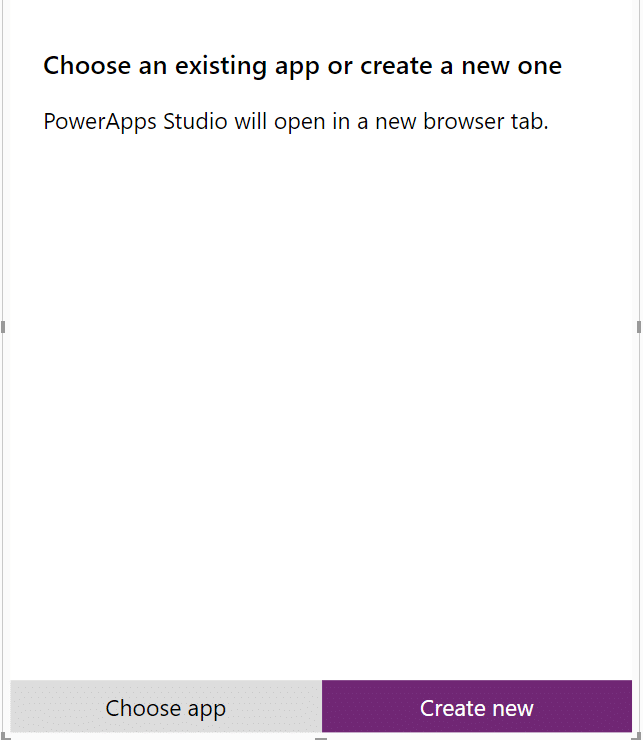
After you click Create new, you will be redirected to Power Apps Studio in your browser. You will have to sign into your Microsoft account if you haven't already. Once you're logged in, you can start working on how your app looks and acts.
Let’s start by fixing how the comments actually display. Click on one of the comments shown and drag the dot to resize the container size.
You’ll see that comments are simply displaying HTML code. Ideally, you want that to be shown as properly formatted text that's easier to read.
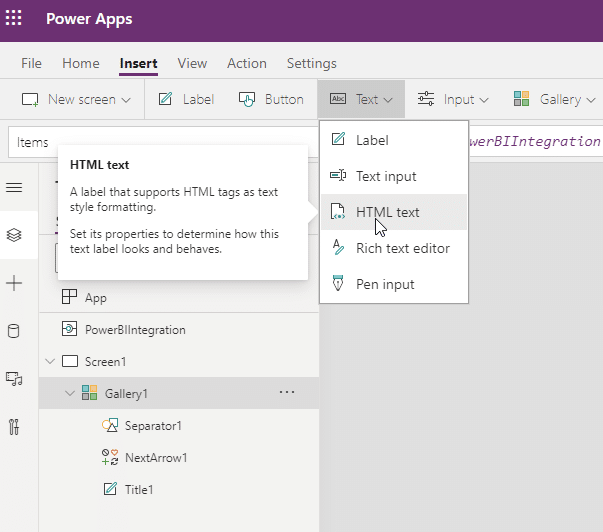
Click on the Insert section in your ribbon and click the dropdown menu on the Text button. From the menu, you can select the HTML text container.
This drops a HTML text container with placeholder text in your form. To display the actual comments, click on the HTML container and insert “ThisItem.Comment” into the function field. This tells the container to fetch the content of the Comment column in your table.
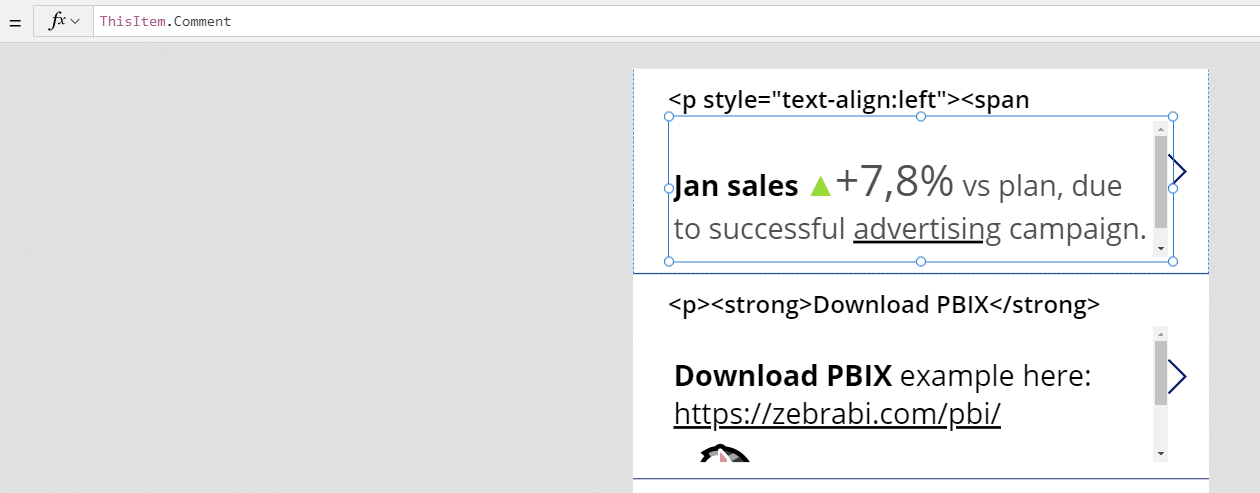
The great thing about this is that it is actually pulling the data from your Power BI, so if it is filtered there it will show up filtered here as well.
You can save your first app by clicking the File tab on your ribbon and then naming and saving your app into the cloud.
However, the quickest way to publish your app is to press CTRL + SHIFT + P, which simultaneously saves and publishes your app.
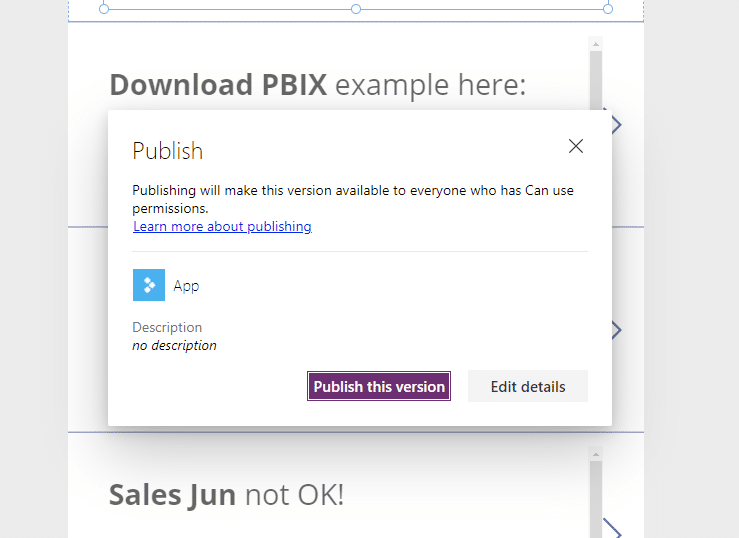
Once it is published, your app is available to everyone and can be accessed and used. If you switch back to Power BI, it will be visible in the Power App visual you inserted earlier.
These comments are dynamic. If you use the slicer to switch between years, the comments will change to reflect the different time period.
Getting there- but imagine doing this in one click instead
Zebra BI has dynamic comments built in natively. No Power Apps Studio, no publishing, no HTML containers.
The next step is to add the ability for users to write and submit their own comments which are then inserted back into your data table. We’ll add a button they can click, type their comments into a form and submit them.
Return back to Power Apps Studio. Resize the comments slightly to make some room for a button at the top of the form. Then click Button to add a button to the form.
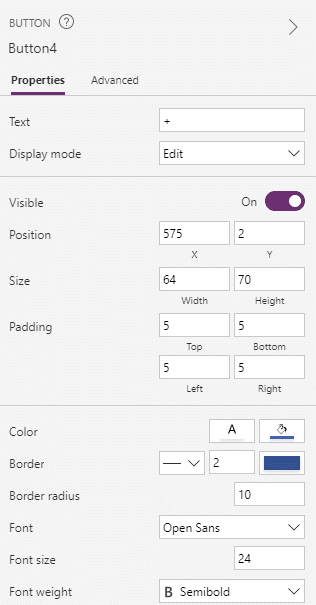
Click on the button to see its properties on the right side of the screen. You can fully customize the look and feel of the button using the settings in here. To start, we’ll just change the text in the button to a plus sign.
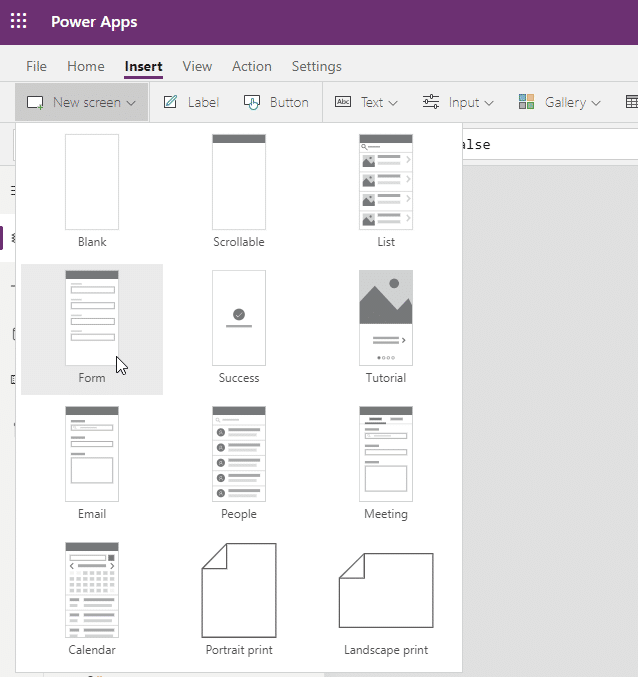
Once you have the button, it needs to do something. First, create a new screen by clicking on the New screen button in the Insert tab and selecting the Form template.
The form template will come in handy for users adding a new writeback comment. First, a word of caution however. New comments cannot be written directly back to the Power BI dataset using the existing Power BI integration. That is something that simply cannot be done.
Your writeback comments need to be sent back to your original table. In our case, this is the Excel table stored in OneDrive. Once the data is updated, Power BI will again load the updated table and show the results in Power BI.
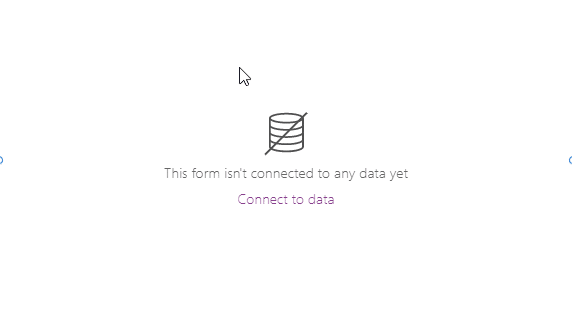
On the form screen, click on the Connect to data link.
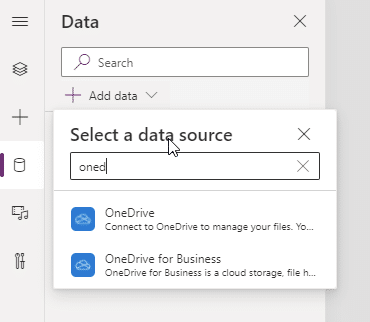
From here, you can select the data source you want. If you have an Excel spreadsheet in OneDrive, click on the Add data button and then type in “onedrive” to quickly locate the service.
On the right hand side of the screen, you can now navigate to the correct folder, select the file holding your data and select the actual table. This creates a connection between the form and the data that will be loaded into your Power BI report.
This getting complicated fast?
Zebra BI lets your team add and edit comments directly in Power BI - no connectors, no Power Apps license, no OneDrive dependency.
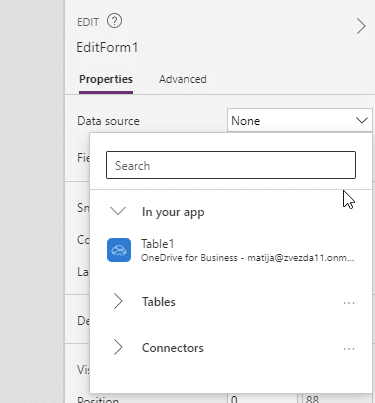
Your form is now connected to your data and you can select the data source on the right hand side by clicking on the Data source dropdown menu.
Once this is done, click on the Edit fields below and then add the relevant fields.
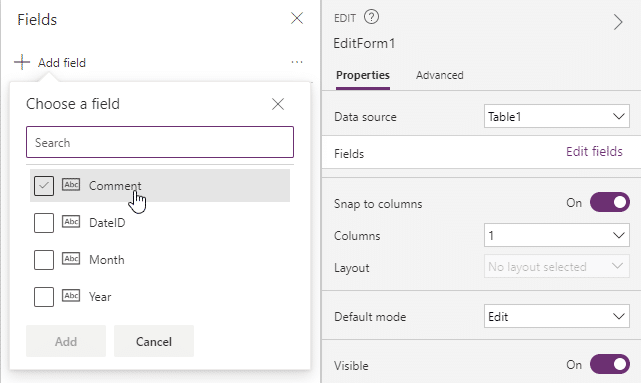
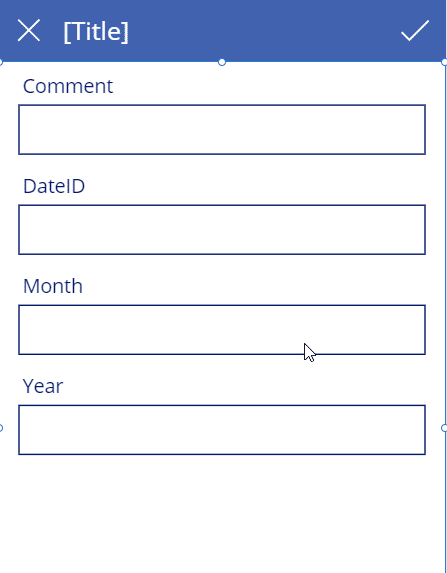
Once you add all the fields, your form is ready.
Your next step is to create a connection between your Add comment button and the form for actually adding it, which is your Screen 2. Click on the button element and open the Advanced tab on the right side of your screen.
You will add the action here. Click on the OnSelect field and put in the following text:
Navigate(Screen2)
This tells the application to move you to the form screen. Test it out by holding down the ALT key and clicking on the button.
In the form template, click the cross button.

Again, click on the button element and open the Advanced tab on the right side of your screen. Click on the OnSelect field and put in the following text:
Back()
This will return the user to the previous screen.
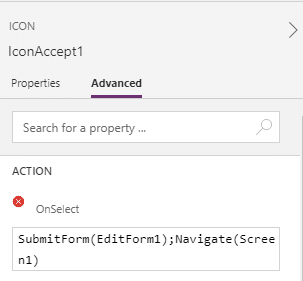
The button for submitting the comment already has its action set up - SubmitForm(EditForm1). To make it a bit more usable, you should add the behaviour, where the user is the returned to the list of the existing comments.
You can add multiple actions, separated by a semicolon to a button. Add the Navigate(Screen1) action to the button.
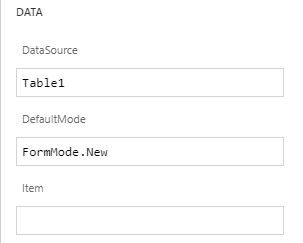
One last thing to do is to set up the form mode. Power Apps distinguishes between three modes - edit mode, new mode and view mode. In our case, we want to use the new mode, which allows us to add new comments to the table.
Click on the form and open the Advanced tab on the right side of your screen. Change the DefaultMode value to FormMode.New.
After you’re finished, press CTRL + SHIFT + P to save and publish your app.
You can now again open your Power BI report and test out the app by adding some writeback comments.
You can make your forms better with some simple tricks. By default, fields in your form are in plain text but you can make them rich with some basic formatting. Click on the Edit fields link on the right side of your project.
Here, you can select the field you want to customize and select the Edit rich text option under Control Type. This gives you a field with rich text formatting control, so you can format the text, add links and other options.

You could also set the Control type to Allowed values, which means you can set up certain values that appear in a dropdown menu. For example, in the Month field, you can set up month names.
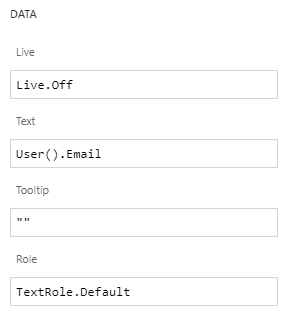
You can also pull in user information. Simply add a label by clicking on the Text button in your toolbar.
Put it onto your form and then put the command User().Email into the Text field. This will pull the current user’s e-mail address into the form. You can then use this information to store user information with individual writeback comments.
You can see adding comments to a Power BI is not all that difficult. However, Zebra BI makes it even easier. We added a comment placeholder that you can use to add comments to your dashboards with a single click. These comments are fully dynamic and interactive based on filters in your report.
The new comment box automatically generates titles based on the category name and even calculates variance for you in case you have a comparison. The red or green triangle marking the difference will help users understand the message even more quicker.
The comment box is responsive and adapts to the size of your table. It's completely dynamic so you can simply switch the time period to see only the relevant comments.
Ready to try it on your own data?
Hi,
Thanks for providing this step-by-step tutorial!
However if I want to be able to edit existing comments and update it back into the excel using power apps, is this possible?
It's like having a notebook, whereby user can write and update.
Hi ZY. Yes, you can set up your PowerApps to update existing records instead of just adding new ones. Best regards.
Adding dynamic writeback comments using Power Apps in Power BI is a game-changer for user interaction. This tutorial fills a crucial gap by enabling direct feedback integration within dashboards. Users can now enhance reports with qualitative insights, transforming data analysis into actionable narratives seamlessly.
Thank you for the feedback! We’re glad you found the writeback comments integration helpful for adding qualitative insights directly into dashboards!
This guide on implementing writeback comments in Power BI using Power Apps is incredibly insightful! The step-by-step instructions make it easy to follow along, and the examples provided are very helpful. It's great to see how seamlessly Power Apps can be integrated with Power BI to enhance interactivity and user engagement. Thanks for sharing this valuable technique!
Thank you for your feedback! We're very glad you liked it.
A very useful article and source for learning such high-quality information! I appreciate you sharing this useful information.
Very well explained 👏
The lack of native commenting in Power BI is something many teams struggle with, especially during leadership reviews where context behind KPIs is critical. Using Power Apps for dynamic write-back comments is a smart and practical workaround.
At Web Synergies, we’ve seen similar approaches work well when Power BI is integrated with SharePoint, SQL, or OneDrive, helping business users add real-time explanations without breaking the flow of analysis. Making comments interactive with slicers adds even more value.
Thanks for sharing this clear, step-by-step tutorial — definitely useful for anyone building executive dashboards.