 September 8th
 February 22nd
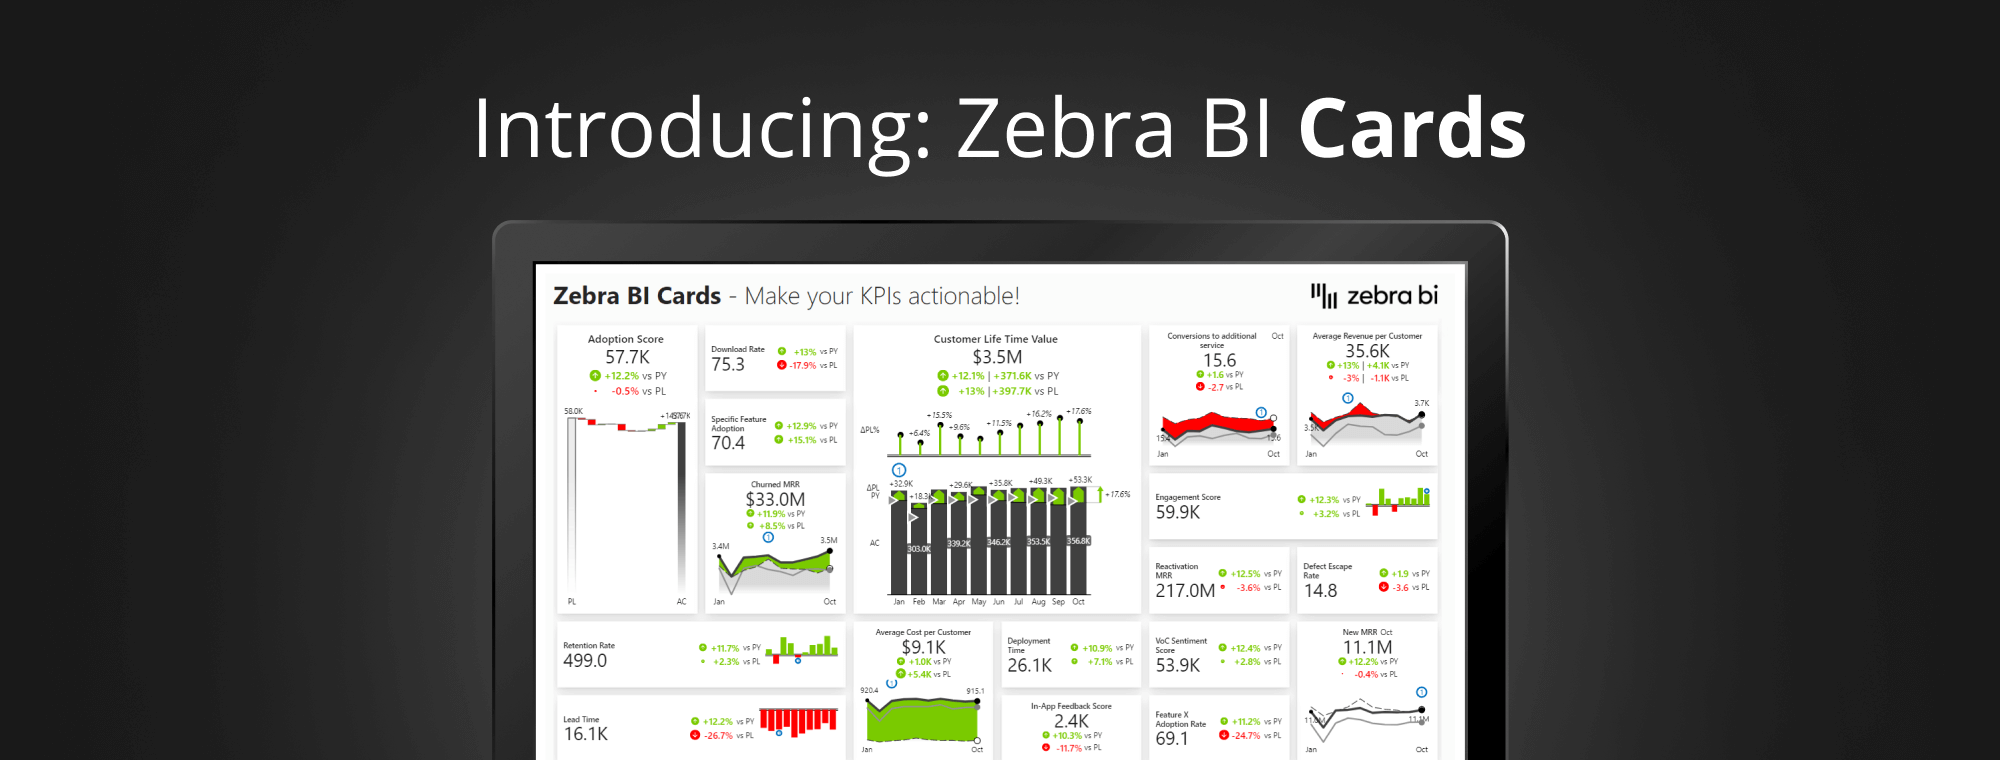
Zebra BI presents Cards: a game-changer for visualizing KPIs in Power BI
Zebra BI, the Actionable Reporting leader leveraging visualizations in Excel and Power BI to extract real-time insights, has launched the new Power BI visual Zebra BI Cards. The new visual is transforming the way of presenting the company’s Key Performance Indicators (KPIs), empowering users to immediately gain insights into how well their business is doing. Cards visual is the next step in the firm’s mission towards understandable and actionable data visualization, thus setting an important milestone for the fast-growing Zebra BI.
Nine out of ten companies struggle with understanding their data, Gartner report shows. If you combine that with a rapidly shorter attention span and messy report landing pages, getting the right information that users need in a short time can pose a huge obstacle in making meaningful management decisions.
Business leaders need to see immediately not only what is happening in their business, but also why are certain outcomes achieved and what action should they take next. The Cards visual enables users to overcome those problems by providing powerful functionalities like comparison with trendline, drill-through, dynamic comments, focus mode, scaling options, and more, that offer additional context and explanation in a matter of a few clicks.
Visualizations built with Cards guide viewers to understand where to focus attention and also answer the question of what is happening with the performance of indicators. If the quick glance does not provide sufficient information, detailed analysis for deeper understanding is available, to ensure minimum action distance. Cards, the third custom Power BI visual from Zebra BI works on top of preexisting Zebra BI Charts and Tables, offering a seamless Actionable Reporting experience.
“Cards will change the way meetings are done,”
believes Andrej Lapajne, the founder and CEO of Zebra BI.
“Traditionally, KPIs employ the poorest data visualization methods. They are usually presented by big annoying numbers, which is not what business users want. The top management expects a really quick overview of the performance of their KPIs and later needs a deeper understanding, so the discussion on how to act upon it can take place immediately. Cards visual stands for all of that, which is why I believe, it makes reports actionable,” explains Lapajne.
Additional Resources
- See the power of Zebra BI Cards first-hand and sign up for a free demo.
- Hear directly from business leaders about why they chose Zebra BI Cards and the impact Actionable Reporting has had on their business.
About Zebra BI
Zebra BI enables analytics teams to deliver real insights in record time, providing business leaders with enough information to make smarter decisions. Zebra BI visualization technologies for Excel and Power BI take data and automatically calculate comparisons to provide context, making advanced reporting concepts available to everyone. Over 2,000 world-leading companies like Microsoft, Coca-Cola, Swarovski, FedEx, and BP trust Zebra BI to power their decisions.
About Microsoft Power BI
Power BI is a business analytics service developed by Microsoft, enabling users to easily connect to unrelated data sources, visualize and discover what’s important, and share that with everyone they want. According to Gartner, it is the outright leader in the analytics and business intelligence platforms industry for the third consecutive year.
Great! Need to try.
Glad to hear that. 🙂 Let us know if any help needed.
I am eager to start a journey with this module.
Awesome Christian. Let us know if you will need some help in the process. 🙂
Dear Zebra Team
I am very excited about new functionality which just published - Zebra BI Cards.
Will you add any to your help center? Any webinar? Or Power BI Template which will show how to create a data model to use Cards in most efficient way?
Regards
Lukasz
Hi Lukasz, thank you for your question! We have already prepared some useful resources on our Help center:
Overview of the Cards visual
4 ways how to consolidated data to start using Cards
We also had a webinar about using Cards to supercharge your Power BI dashboards last week. Available here.
And in 2022 we will of course have more useful content on this topic like articles, templates and webinars.
Hope this helps. 🙂
Regards, Zebra BI Team
This is exciting! Is it available through PowerBI AppSource?
Thanks!
Thank you Don. 🙂 Yes, of course, it's available on Power BI AppSource. https://appsource.microsoft.com/en-us/product/power-bi-visuals/zebrabi1634048186304.zebrabicards?tab=Overview. Also, we would be so grateful if you will give us your review there 😉
Son los mejores gráficos para implementar en informes financieros.
Thank you Pablo. 🙂
Do these CARDS work if I purchase the EXCEL version?
I do not use Power BI
Thanks
Hi, at the moment, Cards visual is only available for Power BI users, but we plan on expanding it to the Office, too. Be sure to follow us for updates.