 September 8th
 February 22nd
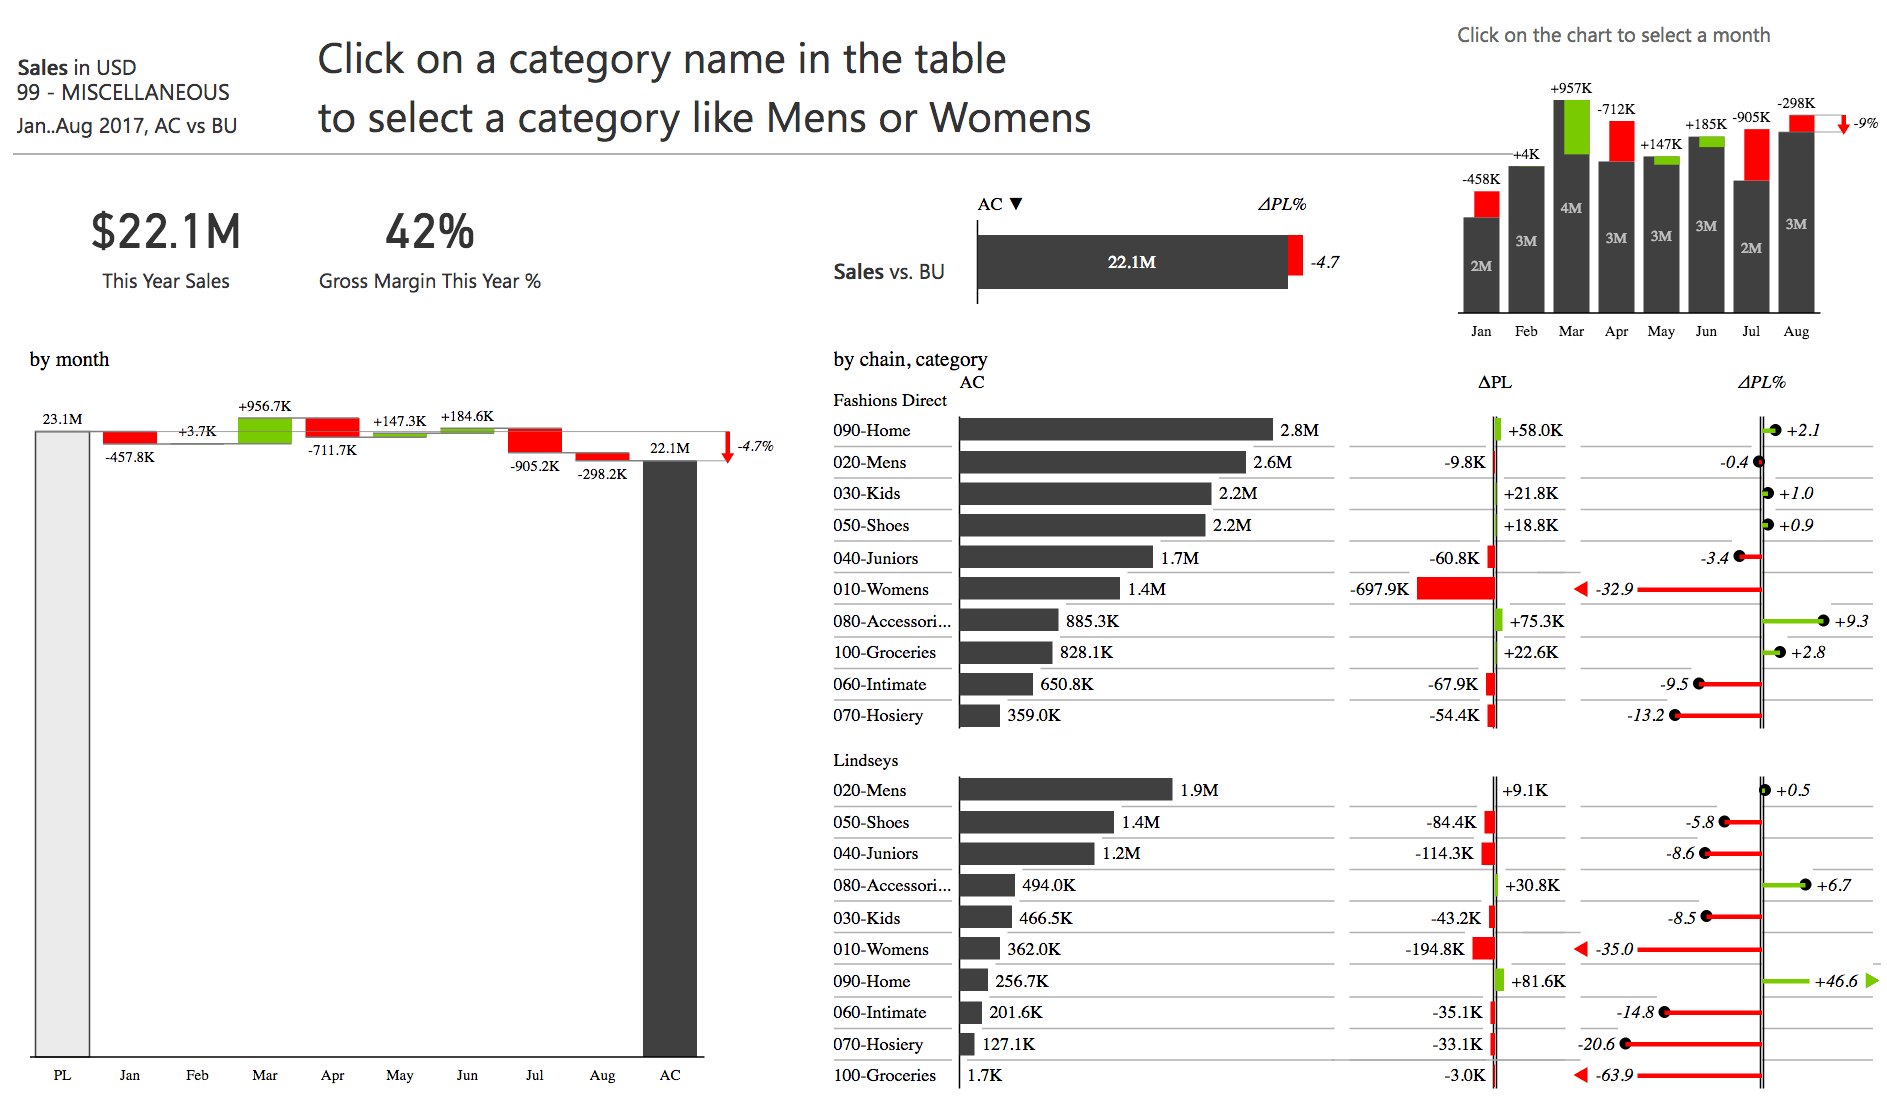
7 things that you can do in Zebra BI visuals that are hard to do in Power BI
PRO Trial
Microsoft's Power BI is a powerful tool for analyzing and visualizing data. There is no doubt about it. However, it falls short in some areas. Try to easily create small multiples or variances in Power Bi. That's where Zebra BI visuals for Power BI come in to extend the out-of-the-box functionalities with powerful features you need to really make an impact. Here are just some of the hundreds of improvements that you get once you start using Zebra BI visuals.
1. Powerful small multiples
Put simply, small multiples are one of the best ways to compare different parts of a dataset. Let's say you want to compare sales of different product categories over the past year. You should use small multiples. When using Zebra BI visuals you simply add another dimension to your existing chart. This will generate a series of charts using the same scale and axes so you can easily compare them.
Take a look at the clean and easy-to-understand design of small multiples in Zebra BI visuals. A single glance tells you that stationery is by far the largest product category. Another look also makes it clear that Pet care products are seriously underperforming.
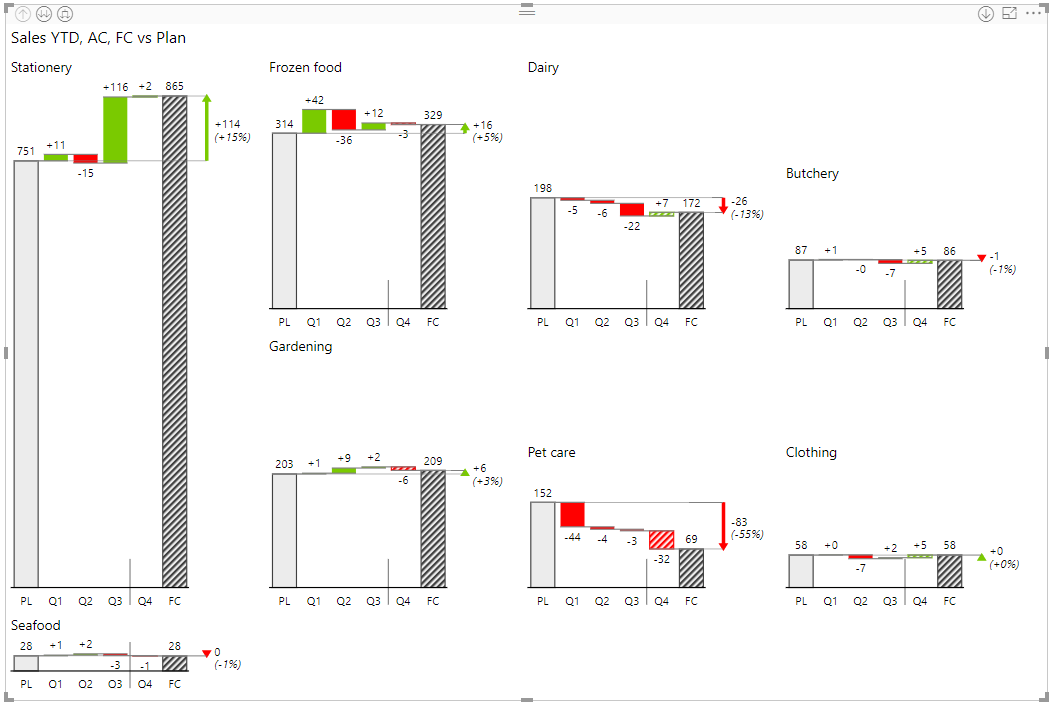
It would be very difficult to replicate the same functionality in vanilla Power BI, while this is one of core features of Zebra BI custom visuals. What's more, you can display a more detailed breakdown by individual months with a single click ...

... or drill down into individual quarters.

2. Automated variance calculations
You only need two columns for your basic variance chart, for example, Actual vs. Budget, Actual vs. Forecast or Actual vs. Previous Year. Insert a new Zebra BI Charts custom visual and simply drag the two measures into the corresponding fields in your visualization properties. Look at the variance chart you can create in just three clicks:
All the variances are calculated automatically and you can click on variance values to switch between relative or absolute variance or both at the same time.
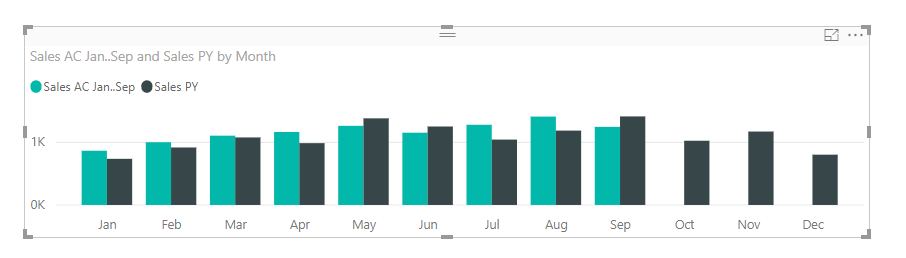
The same data set in default Power BI just doesn't look as good or informative.
3. Advanced chart types
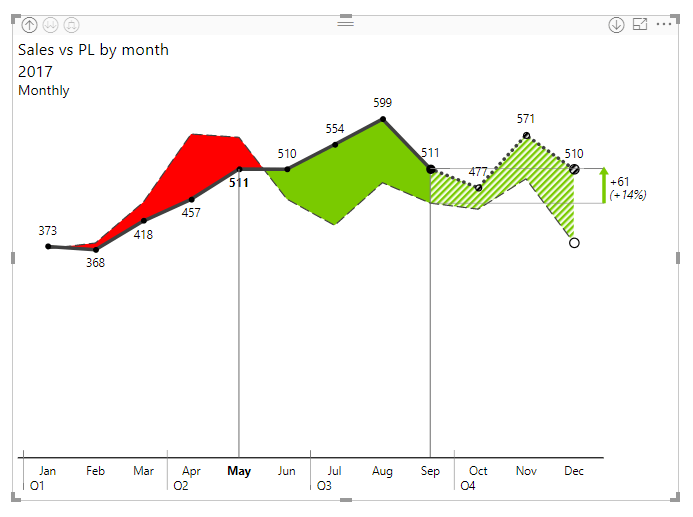
Once you have your variance chart, there is a lot you can do with it. Start by switching between different chart types by clicking on the arrows to the left and right sides of the visual. You can switch between waterfall charts, integrated variance charts, area charts and line charts.
Integrated variance charts are a powerful way to display actual values as well as absolute and relative deviations. Since both values (actual and deviation) are shown, you can see both the importance of a deviation (its magnitude) as well as its relative share of the actual value at the same time.
When you work with a larger number of data points, use an area chart that also shows actual values as well as deviations in the form of an area between the two values.
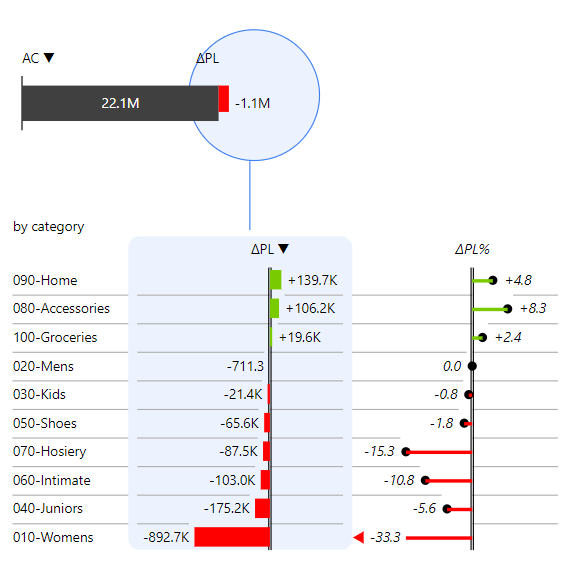
When you want to focus on absolute and relative variance, you can use bar and lollipop charts. If you are not working with a time series, use vertical variance charts to display variance by-products, countries, profit centers or other "structure" dimensions. Here is a sample of a variance chart detailing product category sales on a given month in a single store.
With just a glance, you can view absolute values and their change on bar charts, while the lollipop charts represent relative growth or decrease in percentages.
4. 100% compliance with the IBCS standards
Zebra BI visuals for Power BI is currently the only solution IBCS-certified solution for Power BI. This means that the power of IBCS is available everywhere: on your mobile device, desktop and in the cloud.
5. Fully responsive visuals
All visuals are fully responsive and dynamic. They adapt to the available space and can be resized, moved and customized just the way you need them. Look at how a compact, yet fully readable chart expands into an even more informative visual with multiple data points.
6. Segmented charts
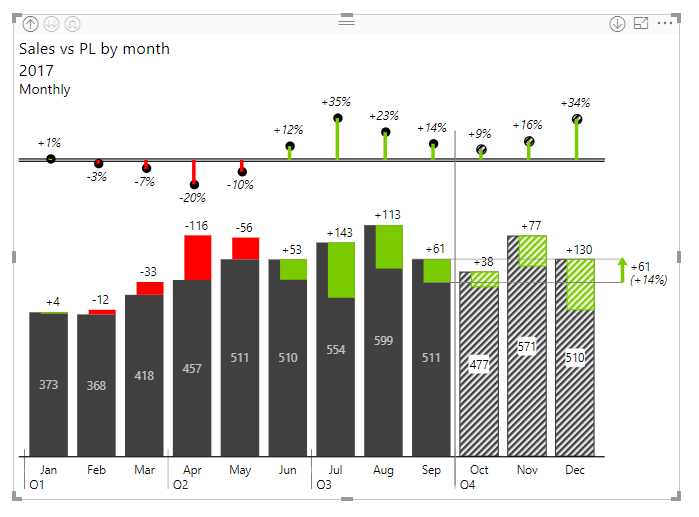
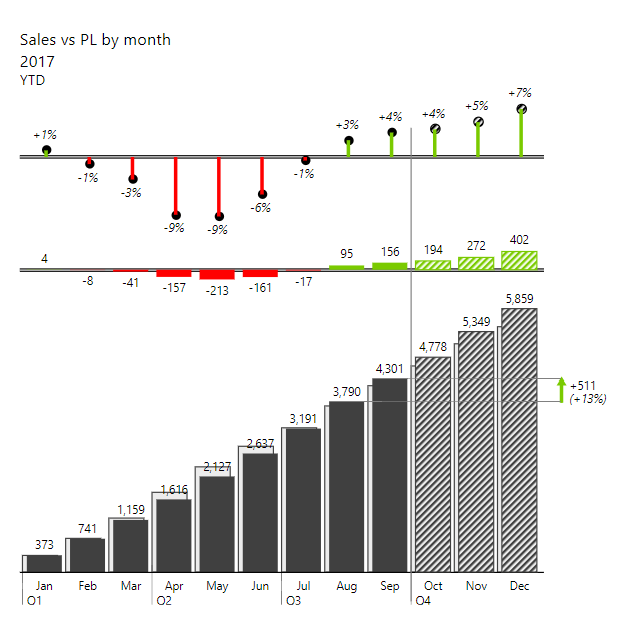
Segmented charts can show multiple comparison points in the same chart, making them ideal for displaying forecasts. Zebra BI visuals for Power BI makes this very easy to do - you just need to drop the forecast values from your model to the Forecasts segment. The forecast is shown in a striped pattern and compared to the planned numbers. This is the easiest way to review your business performance and look into the future, which is what variance reports are all about.
7. Full variance tables
When working with hierarchical data, it can be hard to get information presented just right. Take the chart below. It groups data into individual regions, like Asia-Pacific, EU and Americas. The hierarchical approach allows you to still see the detailed data for individual countries while also providing insight into groups of countries to better allocate your efforts.
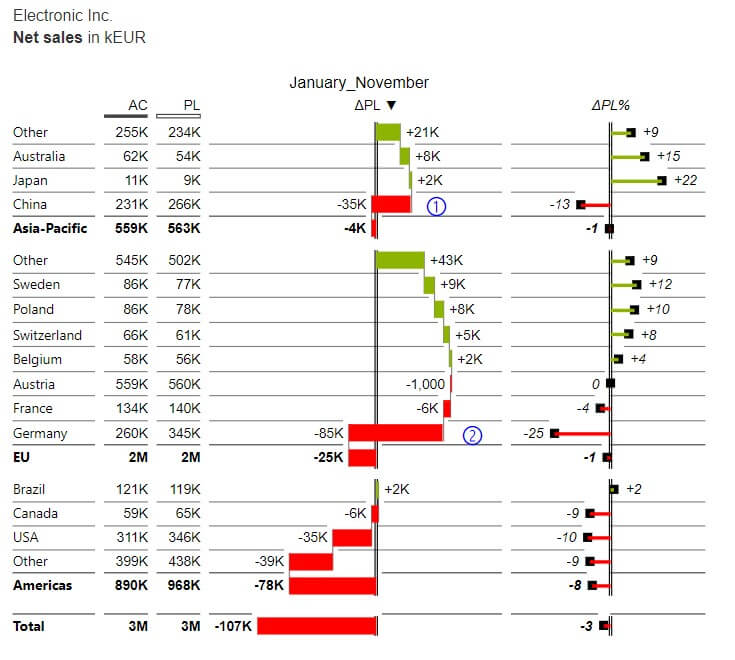
This chart is great for looking at the performance of individual regions and countries. If you want to see how individual countries contribute to the performance of entire regions or even the whole company, you can turn on grand totals and group them by regions. The result is a table and chart combination with three levels of information - the country, region and total.
Want to try Zebra BI visuals for Power BI on your own data? Start your free trial!